Tanzania
Introduction
USAID’s Feed the Future Initiative in Tanzania focuses on rice, maize, and horticulture value chains. Key investments include advancing trade in important crops through improved rural infrastructure and value chain efficiency, making improvements in agricultural productivity, increasing market access through rural roads (to reduce postharvest loss), enhancing the nutritional status of mothers and children, and building public and private sector capacity to address policy constraints. The Initiative also collaborates with US Global Health Initiative. The full list of specific activities FtF is involved in can be accessed here.
Tanzania is involved in several other FtF Innovation Labs for Collaborative Research. The Lab for Integrated Pest Management has a number of projects in Tanzania, one of which focuses on improving productivity of high value horticultural crops. The Lab for Grain Legumes focuses specifically on value-chain performance through improving understanding of consumer behavior. The Lab for Market Access has a project that looks at institutional reform in small-scale fisheries in Tanzania; another project in the Lab evaluates the impact of site-specific soil information on farmer decision-making. The Lab for Aquaculture and Fisheries focuses on capacity building to facilitate the participation of women in shellfish, as well as value-chain assessment in tilapia and catfish. Tanzania is also part of the Lab for Small-Scale Irrigation.
Tanzania is one of the countries in USAID’s Africa Rising Project. The project identifies and tests the best strategies for integrating crops, livestock, and land management while linking enhancing nutrition and marketing. The project considers the role of improved varieties, soil fertility management, and post-harvest processing.
Tanzania online has a lot of info on development issues in Tanzania.
Tanzania is located between a latitude between 11.7 °S and 1 °S. The total land area is about 886 thousand km2. The country is administratively subdivided into 30 Mkoa (Regions), and these are further sub-divided into 183 Wilaya (Districts).
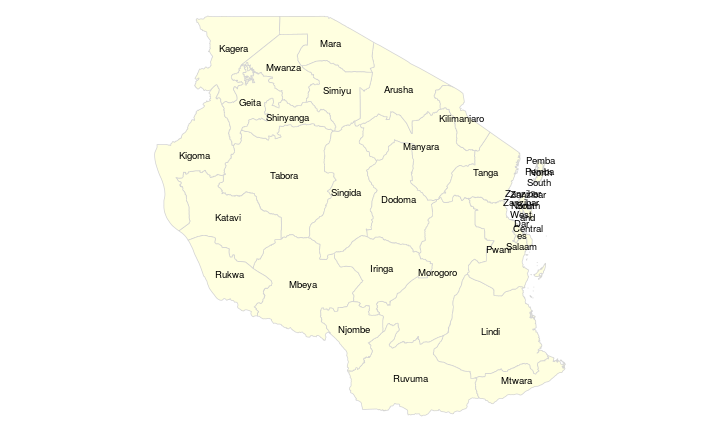
Administrative Divisons Map
The regions of Tanzania
Human development
Population
Tanzania has about 52.3 million inhabitants. The population has increased 2.4 fold over the past 30 years. The economically active population is 26.5 million, 73% of which is employed in agriculture (down from85% in 1985). The rural population was 83% in 1985 and now it is 71%.

Development
It is worth noting that Tanzania is fighting a major AIDS epidemic, which limits productive labor in some regions (Pretty and et al. 2011).
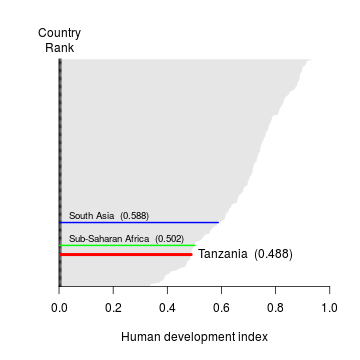
Human Development Index ranking and value
Human Development Index ranking for Tanzania. Data source: UNDP.
Gender
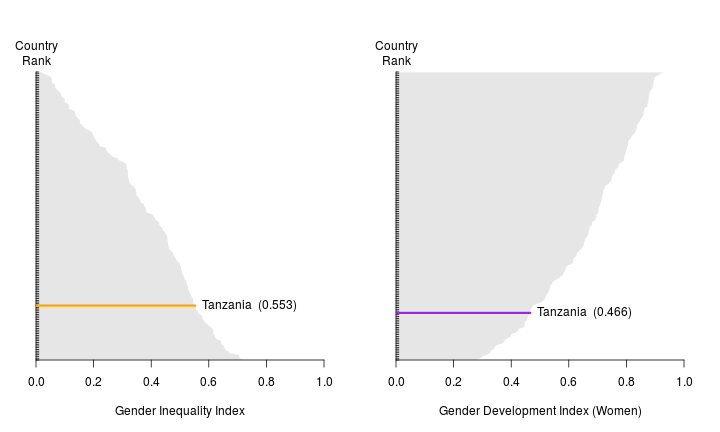
Gender Inequality and Development Indexes
Gender Inequality and Development Indices for Tanzania. Data source: UNDP.
Health and nutrition
Life expectancy at birth in Tanzania has improved modestly from 47 in 1970 to 62 in 2013, but under-five mortality reduced fourfold (from 21 to 5%) over the same time period (UNICEF, 2014). Under-five mortality was 8% in 2010 (NBS & ICF Macro, 2011a). The National Nutrition Survey found a large reduction in stunting from 42% in 2010 to 35% in 2014 (MHSW & TFNC, 2014; NBS & ICF Macro, 2011a). Underweight also reduced from almost 16% to just over 13% during the same time period, while wasting remained unchanged at roughly 5%. Interestingly, the National Panel Survey (NPS) found an increase in wasting from 3% in 2008/09 to 7% in 2010-2011; however, this change likely reflected an acute period of malnutrition. Rural households generally have a greater burden of child anthropometric indicators than urban households. Poverty is clearly associated with higher rates of stunting and underweight, but seems to be unassociated with wasting.
Only about 3% of women in Tanzania have short stature (height < 145 cm, NBS & ICF Macro, 2011a). On the other hand, there are nearly four times as many women overweight or obese (20% have a BMI ≥ 25) than underweight (5.5% have a BMI < 18.5, MHSW & TFNC, 2014). Urban women are more than twice as likely to be overweight or obese as rural women (NBS & ICF Macro, 2011a). Variation in underweight and overweight prevalence between regions is vast: Less than 5% of women are estimated to be underweight in Mbeya as opposed to 25% in Dodoma (NBS & ICF Macro, 2011a). Conversely, only 10% of women in Dodoma are estimated to be overweight or obese compared to 47% in Dar es Salaam (NBS & ICF Macro, 2011a). A nutrition transition is taking place in all of Tanzania, even in rural populations. A recent study found the prevalence of overweight and obesity in women from three rural districts to be three times higher than underweight women (Keding et al., 2013). To our knowledge, no anthropometric data is available at the country level for men.
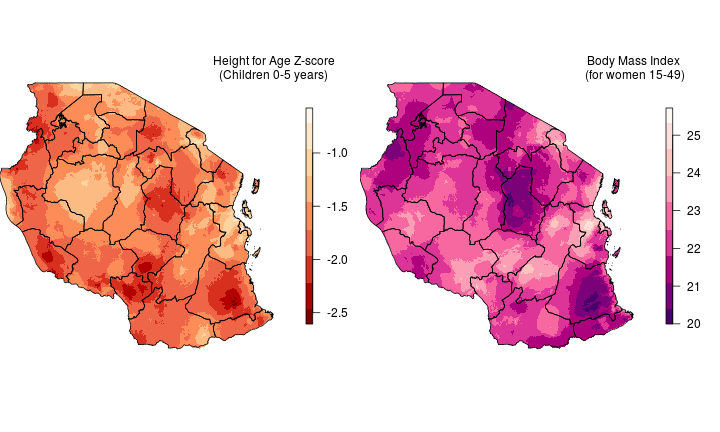
Child height-for-age Z-score and women’s body mass index
Average height-for-age Z-score for children (a child with a score less than -2 is considered stunted), and body mass index for women. Data source: DHS.
Micronutrients
In Tanzania, known micronutrient deficiencies include iron, vitamin A, and iodine, and there are likely others, such as zinc and calcium, that have not been assessed. According to the Tanzania Demographic and Health Micronutrient Survey (TDHMS), anemia burdens 59% of children (41% from iron deficiency) and 41% of women (35% from iron deficiency, NBS & ICF Macro, 2011b). Further, about 35% of children and 30% of women are deficient in iron. Approximately 41% of women took no iron supplements during their last pregnancy (NBS & ICF Macro, 2011b). An estimated 33% of children and 37% of women are vitamin A deficient. Roughly a quarter (26%) of women took a postpartum vitamin A dose (NBS & ICF Macro 2011b). About 36% of women are iodine deficient, and 47-60% of households have adequately iodizes salt (NBS & ICF Macro, 2011b).
Dietary diversity seems to be increasing in Tanzania, but the proportion of households experiencing high food energy deficiency increased from 24% in 2008-09 to 29% in 2010-11 (WFP, 2012). Approximately 8% of households have poor dietary intake (PDI), which indicates high energy deficiency and low dietary diversity (WFP, 2012). About 18% of households have low dietary diversity (consumed four or less food groups out of seven, WFP, 2012). On average, 70% of calories consumed in Tanzania come from starchy staples; nearly a third (30%) of households obtain over 75% of their calories from staples (WFP, 2012). Obesogenic diets in Tanzania consist of bread, cakes, sugar, and tea (Keding et al., 2013). Rural households consume on average 58% of calories from their own production. The central zone has the highest rate of chronic PDI (5%), indicated by high rates of PDI in both 2008-09 and 2010-11 (WFP, 2012).
The New Alliance for Food Security and Nutrition works on policy changes and investments African agriculture to benefit smallholder farmers and reduce hunger and poverty. They have a country report for Tanzania.
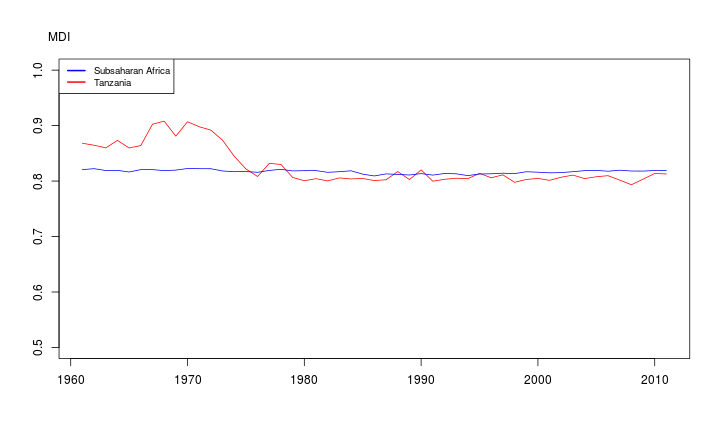
MicroNutruent Density Index
Micronutrient Density Index (MDI) between 1961 and 2011. Source: Beal et al.
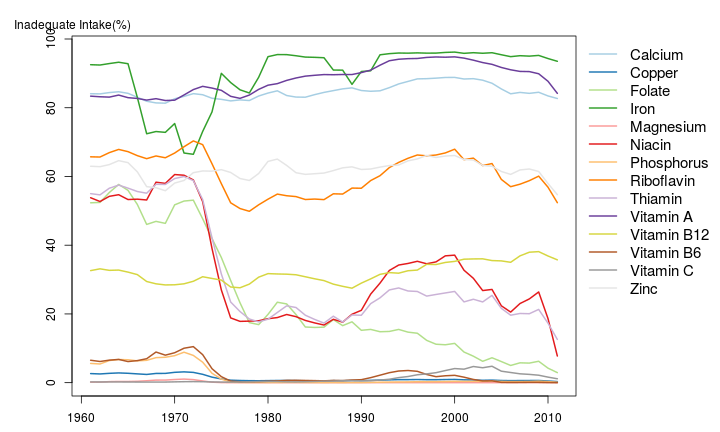
Prevalence of Inadequate Nutrient Intake
Estimated prevalence of inadequate intake (%) of micronutrients between 1961 and 2011. Source: Beal et al.
Land and water resources
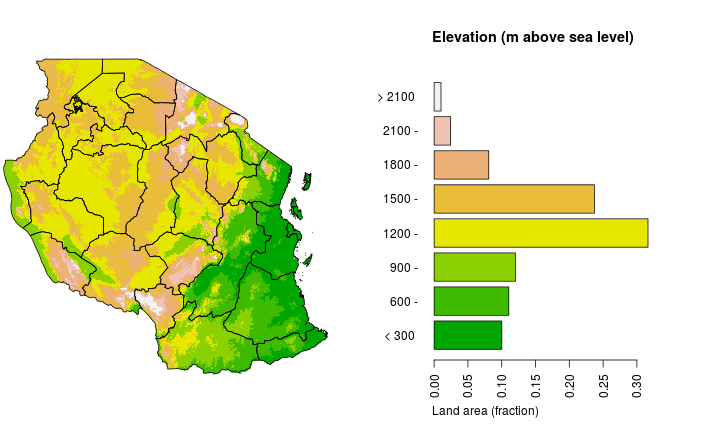
Elevation
The elevation of Tanzania is between 0 and 5780 meters above sea level. Half the land area is below 1130 meter and in between 720 and 1280 meter.
Climate
The climate in Tanzania varies by location, from tropical along the coastal region to temperate in the interior highlands. The central and southern highlands have a single rainy season from October/November to April. The rest of the country experiences two rainy seasons, a short rainy season from October to December called Vuli and a long rainy season from March to June called Masika. The highest rainfall in the country occurs in the Lake Tanganyika basin as well as the southern highlands.
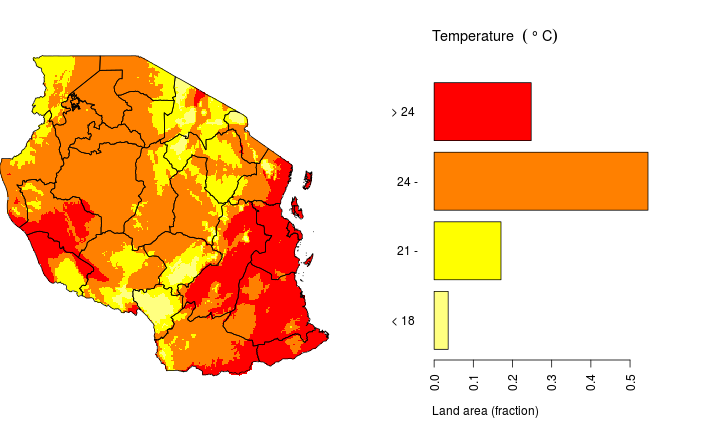
The annual average temperature in Tanzania is between -3 and 27.8 °C. The median annual average temperature is 22.6 °C and half the land area has an annual average temperature between 21.3 and 23.9 °C. For more details see the monthly temperature maps. For projected future climate change, see these maps.
data source: WorldClim
Average annual mean temperature (°C) for 1950-2000 in Tanzania. Source WorldClim
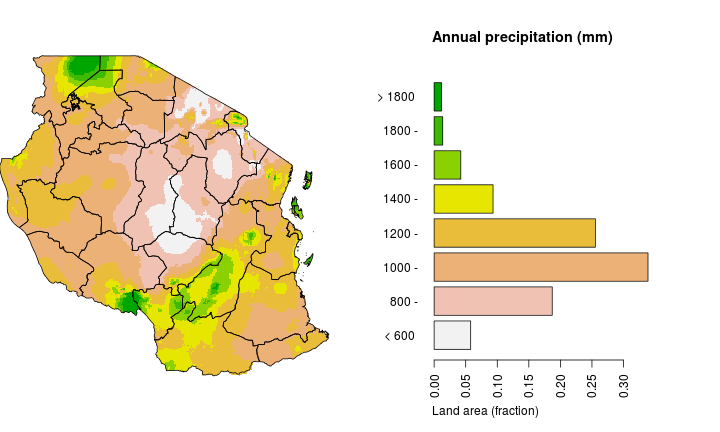
The annual total precipitation in Tanzania is between 410 and 2440 mm. The median is 970 mm and half the land area has an annual total precipitation between 800 and 1110 mm. For more details see the monthly precipitation maps. For projected future climate change, see these maps.
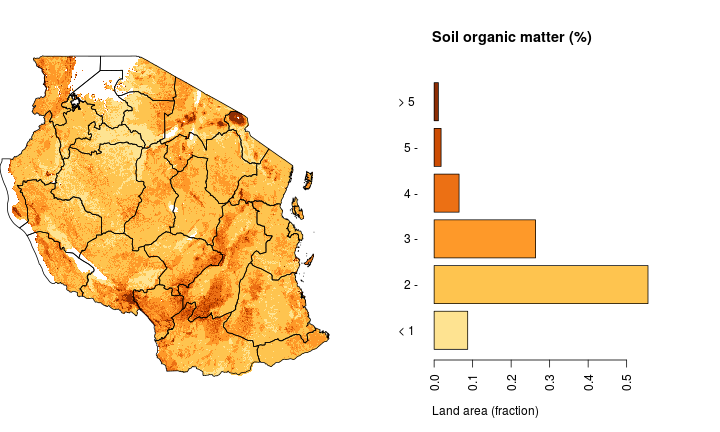
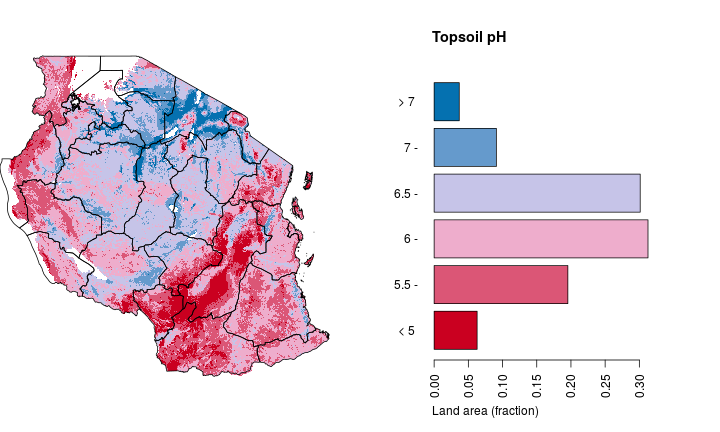
Soils
Water
Tanzania has several large lakes along the borders with Uganda (Lake Victoria), Congo (Lake Tanganyika), and and Malawi (Lake Malawi). The country does not have major rivers. There are nine major drainage basins in Tanzania that end in three distinct different bodies of water: the Indian Ocean, Mediterranean Sea, and the Atlantic Ocean. The majority of the country including the Pangani River, the Rufiji River, and the Lake Malawi basin drain to the Indian Ocean. The Lake Victoria basin feeds the Nile River, and ends in the Mediterranean. The western region of the country, including the Lake Tanganyika basin, drains through the Congo River to the Atlantic Ocean.
Water usage in Tanzania was estimated to be 5,142 million m3 in 2002, of which the vast majority (85%) was consumed by irrigated agriculture. Despite this, irrigated land is quite a small percentage of the total land with potential for irrigation. About 10% of the area that could potentially be irrigated has irrigation equipment. Almost all of this irrigated land is fed with surface water, with only an estimated 0.2% fed with groundwater (FAO AQUASTAT).
Renewable groundwater resources are estimated to amount to 30 km3/year. There is a problem with excessive fluoride in the drinking water (British Geological Survey).
Tanzania has 5 dams, with total capacity of 4196 million m3. Three of the four main dams are in the Rufiji River basin.
Water policy and investment
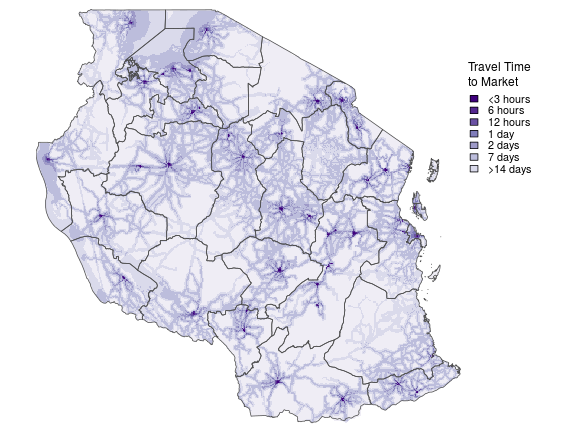
The 2002 National Water Policy and 2006 National Water Sector Development Strategy support the devolution of water management and the development of localized water supply and sanitation plans. The 2009 Water Resources Management Act implements these policies by outlining water governance institutions including National Water Boards, Basin Water Boards, and Water User Associations. The Act requires anyone that diverts or abstracts water for uses other than domestic purposes get the Basin Water Board’s approval. Landholders are permitted to access groundwater through hand-dug wells with permits, yet if the Ministry of Water and Irrigation (responsible for implementation of all water policies) calls an area a “Groundwater Controlled Area”, permits are then required. The 2009 Water and Supply Act focuses on drinking water supply and sanitation and devolves authority to basin levels: the Community Owned Water Supply Organizations (COWSOs) are in charge of water access, fees, and infrastructure. The National Water Sector Development Programme (2006-2025) and the Agriculture Sector Development Programme outline a series of investment in irrigation, but progress has been slow (Gine and Perez-Foguet, 2008; USAID, 2011b). The programs have also focused more on engineering components as opposed to social and participatory components (Gine and Perez-Foguet, 2008). A lack of focus in the latter is particularly problematic since local water bodies are responsible for their own cost-recovery (Gine and Perez-Foguet, 2008), and because designing and implementing water management plans requires technical skills, oversight, and cooperation.
Map of Irrigated Agricultural Land
Percentage of agricultural land that is irrigated. Data source: GMIA
Tanzania has attracted attention from the index insurance industry for several years (Osgood et al., 2007). The IFC/World bank and Syngenta Foundation have been working in East Africa since 2009 on a project called Agriculture and Climate Risk Enterprise (ACRE). ACRE, previously known as Kilimo Salama, is active in Kenya, Rwanda, and Tanzania, and insures 4,310 farmers in Tanzania for drought, excess rain, and diseases.
In 2011, a consortium led by World Vision and MicroEnsure started a pilot project called MLAP (Market-Led Agricultural Product). The project offered weather insurance to 24,000 cotton farmers. The project continued to operate at least as of 2014.
Land tenure
The President in Tanzania has the authority to allocate and determine the use of most of Tanzania’s natural resources, including land and water. The 1995 Land Policy and 1999 Land Act and Village Land Act supports both private property rights and some customary rights. The law legalizes land inheritance and transfer, and outlines four different types of land: village, customary rights of occupancy, granted right of occupancy, leasehold, and residential license. In rural areas, village and regional authorities remain in control of most smallholder farmland and are in charge of allocating the first three types of land. Because transferring customary rights in these settings is confusing and under village authority, most farmers do not have confident ownership of their plots. The 2004 Land (Amendment) Act expands mortgage provisions, making it easier for lenders to take possession of mortgaged land if the borrower defaults. Although the Strategic Plan for the Implementation of the Land Acts (SPILL) was established in 2006 due to poor implementation and enforcement of legal rights, the general consensus seems to that in most rural areas, occupancy rights have not been registered and thus land cannot be used for collateral (all from USAID 2011). The bias in land tenure legislation that addresses land issues for smallholders and land tenure for commercial farmers seem to promote the formalization of tenure for some and not others (Pallotti 2008). Commercial development is usually facilitated by the central government. The Ministry of Lands and Human Settlement Development is responsible for implementing land policy.
Food production
Crop production
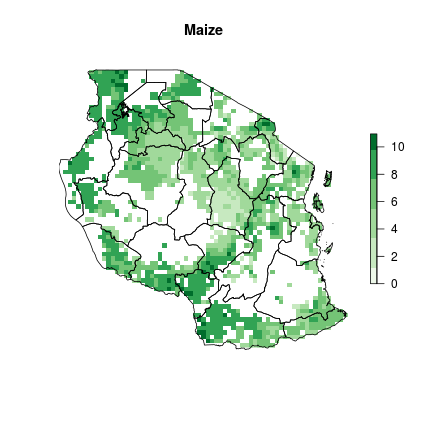
Maize is by far the most important crop, and main staple, in Tanzania.
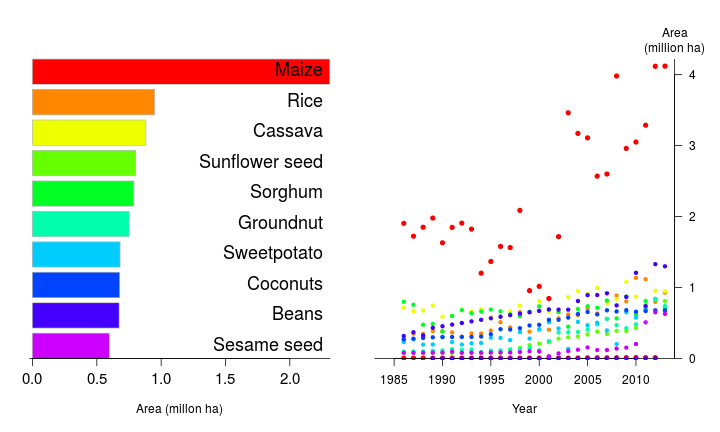
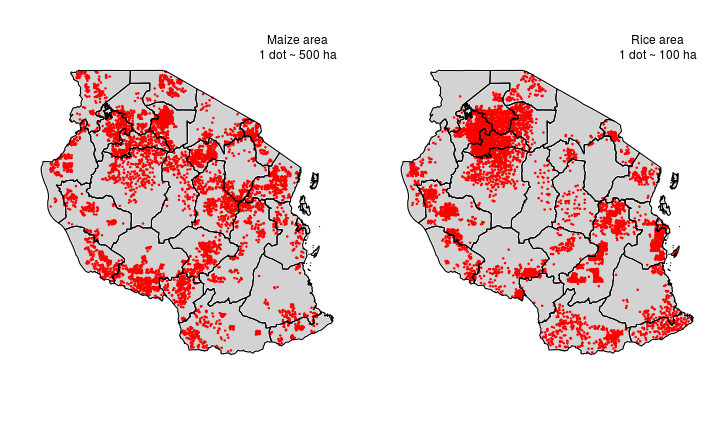
Cultivation Distribution
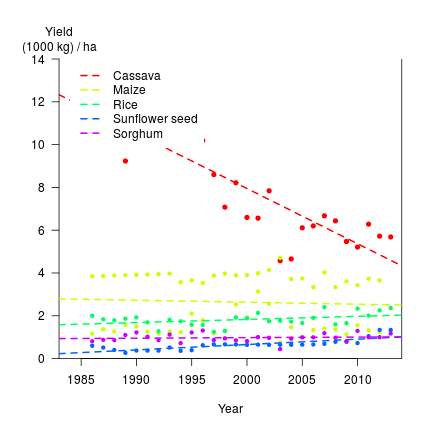
Crop Yield
Crop yield over the past 30 years, for the main five crops in Tanzania. Data source: FAO.
Annual linear growth rates of crop yield over the past 30 years, for the main five crops , were between -258 (Cassava) and 25.1 (Sunflower seed) kg/ha
Livestock
A series of policies and policy frameworks govern livestock production in Tanzania. The 2010 Livestock Sector Development Strategy (LSDS) was established as an implementing framework and operational tool for the 2006 National Livestock Policy. The LSDS has overarching goals in food security and increasing farm income. To do this, the framework emphasizes the delivery of livestock services and inputs to farmers, strengthening the capacity of farming communities and the private sectors, and enhancing capacity of national and local government institutions that provide services to livestock farmers. Seven objectives and 32 outputs guide the tasks of LSDS; they range from means to increase production (eggs, milk, meat, draught animals), disease control and the provision of veterinary services, enhanced product marketing (e.g., infrastructure, information, processing, identification, and traceability), and legal and institutional strengthening (including regulations). The LSDS lays out very specific goals in these areas (GoBF 2010). In 2014, the Ministry founded the National Livestock Policy Hub, which is anchored in the Ministry of Livestock and Fisheries Development.
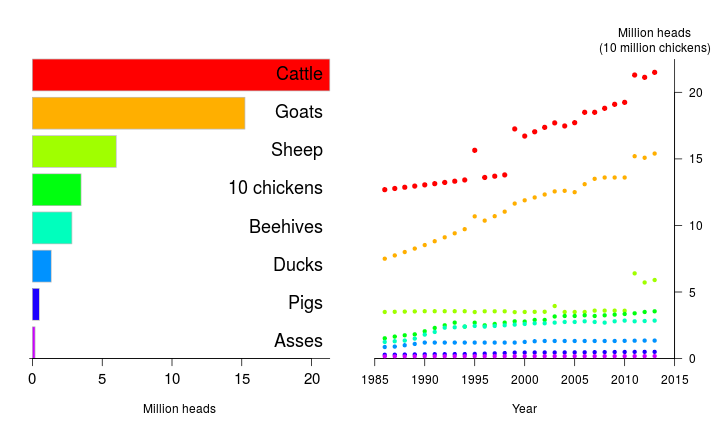
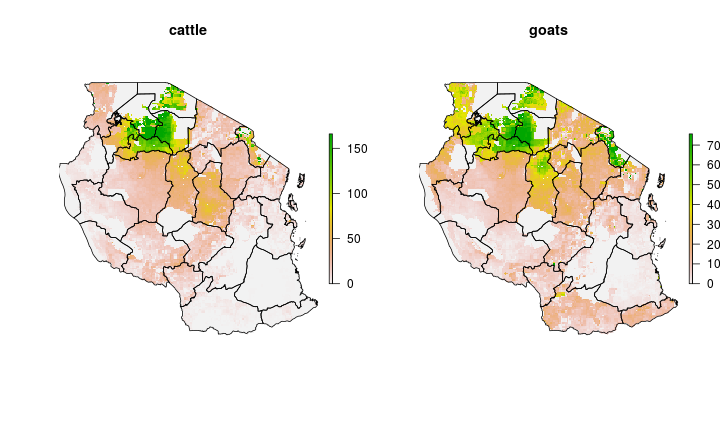
Livestock Distribution
Spatial distribution (head per km2) of cattle and goats in Tanzania. Data source: Gridded Livestock of the World. More livestock maps.
Aquaculture and fisheries
The 1997 Fisheries Sector Policy and Strategy, 2003 Fisheries Act, and 2004 Principal Fisheries Regulations are some of the key legislation guiding aquaculture in Tanzania. Objectives of these policies include conservation and sustainable management and are carried out through harvest requirements such as annual licensing (FAO n.d.).
Tanzania borders the coast, but not much significant aquaculture/mariculture exists, and is rather characterized by “vast but as of yet untapped potential”. A 2008 report (Wetengere et al. ,2008) indicates that a task force undertook a National Aquaculture Development Strategy. The report concludes that the government should encourage farmer-to-farmer extension to promote growth in the aquaculture industry.
Intensification
The Tanzanian economy has undergone changes through a series of policy reforms including the privatization of state firms, investments in infrastructure and information and communication technologies, and improvements to policies that involve the private sector. Government revenue increased from 10 percent in 2000 to 16 percent in 2010 (Ministry of Finance 2012). Between 2002 and 2011, government spending on agriculture ranged from 4.5-7.8 percent of the national budget (Cooksey 2013).
The country has several agricultural sector strategies, including the 2008 Kilimo Kwanza (KK), the 2011-2015 Agricultural Sector Development Programme (ASDP) and the 2011 Tanzania Agriculture and Food Security Investment Plan (TAFSIP). The merits of these policies are mixed. Some suggest that the policies are state-centric and incoherent, and mostly benefit Tanzania’s local elite (Cooksey 2013). Another criticism is that multiple offices design and implement policies, leading to overlap and a lack of comprehensiveness. The KK policy emphasizes the role of the private sector and TAFSIP focuses on commercialization and irrigation. Most of these policies emphasize activities in the four southern highlands regions where commercial farmers are located (ibid). These policies emphasize foreign investment and commercialization (agro-industry, marketing, and trade) and put less emphasis on strategies to support smallholder farmers.
Like many governments in Africa, the Tanzanian government introduced a large subsidy program following the 2007-2008 food crises. The 2009 National Agricultural Input Voucher Scheme (NAIVS) focuses on the distribution of fertilizer and improved seed for two of the main staple crops, maize and rice. For the most part, the program does not crowd out the private sector (Benson and et al. 2012): it is implemented via the Tanzania Fertilizer Company and facilitates the purchase of inputs from private input dealers. In 2011, the program had expanded to 87 districts and reached over 2.5 million farmers (ibid). Despite the program’s breadth and special committees that facilitate voucher targeting based on merit criterion, Pan (2009) finds that local elites receive approximately 60 percent of the distributed vouchers. The distribution process goes from the central government allocates vouchers to the target regions, where regions distribute to districts and districts distribute to villages. The authors suggest that greater involvement of extension agents might improve targeting (Pan and Christiaensen 2012). The political structure, and lack of clarity between levels and executive versus legislative roles, may also have an affect on the success of targeting practices.
Benson (2012) indicates that the enabling environment surrounding fertilizer subsidies may inhibit the success. The Dar es Salaam port and road infrastructure needs upgrading, although roads in Tanzania are in fairly decent condition compared to neighboring countries (AICD 2010). Farmers and small business also have limited access to credit. The regulatory regime on fertilizer also increases costs of fertilizer and therefore the costs to farmers, as do the restricted export markets. To protect domestic food supplies, the Government of Tanzania has tight restrictions on staple food exports. The policies are at odds with one another and reduce the returns to investment for both farmers and government. The 2009 Fertilizers Act is purposed to regulate the importation, distribution, and storage of fertilizer in order to ensure quality. As of 2012, the regulations from this legislation had not been implemented.
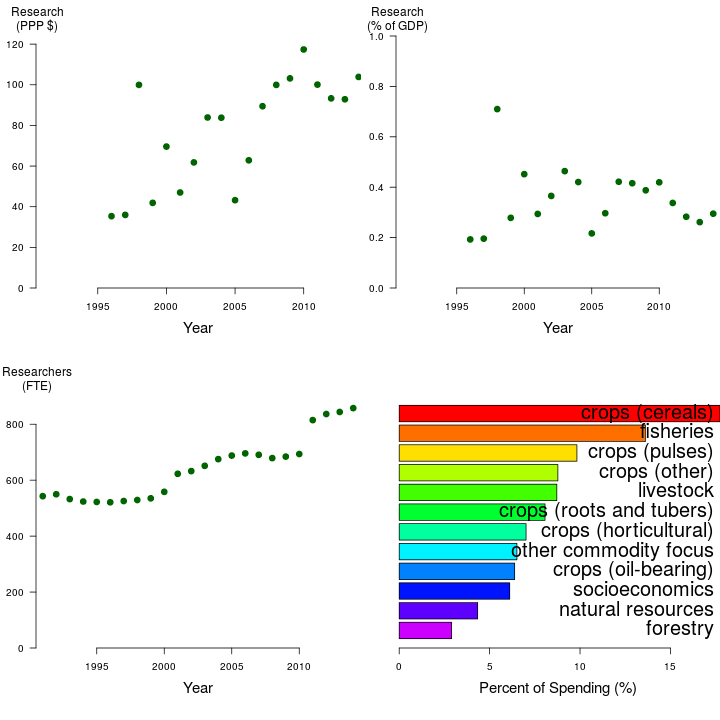
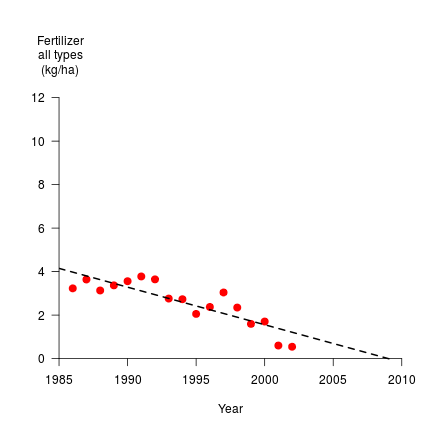
Investment in Agricultural Research
Investment in Agricultural Research over time and by commodity groups ( data source: ASTI).
Yield gaps
Yield Gap
Yield Gap (1000 kg / ha).
Selected research and development priorities and projects
The research programs within the CGIAR have several projects in Tanzania, which include some of the following. The International Livestock Research Institute has a number of projects that focus on small-scale irrigation for livestock feed production, molecular epidemiology networks for the delivery of vaccines, disease in smallholder dairy cows, the integration of dairy goats and root production, and value chains. The Livestock and Fish Program focuses on smallholder dairy value chains. Tanzania is also part of the mNutrition project. The Climate Change, Agriculture and Food Security Research Program works in Tanzania, but does not have specific projects for the country alone at this time.
The Tanzania Natural Resource Forum is a member-driven NGO that seeks to improve governance and accountability in Tanzania’s natural resource sector to achieve more sustainable rural livelihoods and better conservation outcomes. The Tanzania (http://tanzania.vitalsigns.org/)[Vital Signs] team collects and integrates data on agricultural management and productivity, ecosystems and human well-being to provide near real-time data and diagnostic tools to help inform agricultural decisions and monitor their outcomes.
FAO has several projects in Tanzania, which include food systems development, conservation of globally important agricultural heritage systems, transboundary agro-ecosystem management in the Kagera river basin, and the protection from cassava disease, among others. FAO is performing the Towards Climate Change and Adaptation project in Tanzania PDF. The project encourages collaborative management of land and water amongst farmers in Kiroka, Morogoro region. The Partnership for Agricultural Water for Africa AgWA led by the FAO is active in several African countries, including Tanzania. AgWA is an autonomous voluntary partnership that seeks to develop synergy between national and international institutions, as well as provide technical support for The five priority areas are Advocacy, Partner Harmonization, Resource Mobilization, Generating and Sharing Knowledge, and Capacity Building. Specific to Tanzania, AgWA has completed a project called Building up Mature Partnership for Scaling up Agricultural Water Management in Africa, which helped to establish AgWA implement its first two years of operations.
The most recent Poverty Reduction Strategy Paper prioritizes irrigation and rain harvesting infrastructure, land reform for large and small scale uses, mechanization, agro- and fishery processing, extension services, fair and competitive prices for farmers, longer shelf life for fishery and agricultural products, and promoting aquaculture industry development, among other things (IMF PRSP 2010). Tanzania is also part of the Science for Nature and People (SNAP) project, a collaborative between the Nature Conservancy, Wildlife Conservation Society, and the National Center for Ecological Analysis and Synthesis. The project seeks to guide investment in infrastructure to expand commercial agriculture while maintaining ecosystem services and the protection of biodiversity. Finally, the Agricultural Water Solutions Project (AWM) PDF, active from 2008-2011, is a project by a consortium of research, scientific, and commercial organizations that seeks to unlock the potential of smallholder farmers in many countries around the world, including Tanzania. The AWM focuses on addressing the needs of target populations rather than focusing on the development of additional water resources. One focus of the AWM is on mapping livelihoods, in order to understand the needs of the constituent farmers.
The US African Development Foundation supports many projects in Tanzania
Nature conservation
According to the World Database on Protected Areas, 32% of terrestrial Tanzania is under some form of protection (IUCN & WDPA 2015). This includes 10 wilderness areas (Category Ib), 12 national parks (Category II), one natural monument (Category III), 68 habitat/species management areas (Category IV), and 18 managed resource protected areas (Category VI), as defined by the IUCN. Across Tanzania UNESCO has designated four natural areas as World Heritage Sites, along with three Biosphere Reserves. Additionally, the country contains three Ramsar Wetlands of International Importance.
Tanzania is home to 720 species on the IUCN Red List of threatened and endangered species. This includes one species that is Extinct in the Wild, 93 listed as Critically Endangered, 282 as Endangered, and 344 as Vulnerable. Furthermore, Tanzania contains eight sites noted by the Alliance for Zero Extinction as locations having an imminent risk of species extinctions. These sites contain 25 at risk species.
There are a variety of major global or regional environmental non-governmental organizations that have current conservation programs operating in Tanzania. These include The Nature Conservancy (Northern Tanzania Volcanic Highlands and Greater Mahale Ecosystem/Lake Tanganyika), BirdLife International, Wildlife Conservation Society (Zanzibar, Tarangire, Ruaha, and the Southern Highlands), WWF (Coastal East Africa), Fauna and Flora International, and African Wildlife Foundation (Maasai Steppe, Kilimajaro, and Ruaha).
Global conservation prioritization methodologies have highlighted a total of 98% of Tanzania as having conservation importance. This includes Biodiversity Hotspots (17% of the country), Global 200 Ecoregions (89%), Important Bird Areas (17%) and regions considered to be the Last of the Wild (3%) as defined by Wildlife Conservation Society. However, no area in the country is recognized as a Frontier Forest (Global Forest Watch).
The map on the left shows biodiversity conservation priorities generated by combining numbers of vertebrate species, (excluding reptiles), IUCN threatened species, and small-ranged species (data from Jenkins et al. 2013) per 10 km2 cell. Thus, the areas with the highest values (shown here in red) not only have the greatest diversity of species in Tanzania, but also show those areas where species are or might become threatened with extinction. The map on the right highlights 17% of the terrestrial area of Tanzania containing the highest conservation priority values (a 17% target was chosen in accordance with the 2010 Convention of Biological Diversity). The same analysis at both regional and global scales highlights 53% and 33% of the nation respectively as meeting the CBD targets as defined in this analysis.
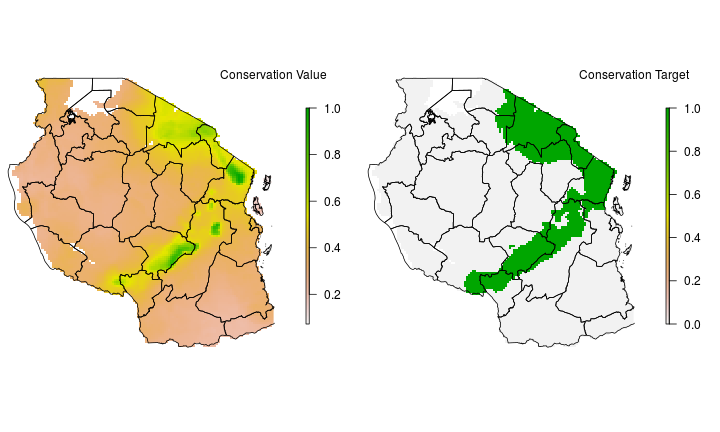
Conservation Priorities
Conservation Priorities.
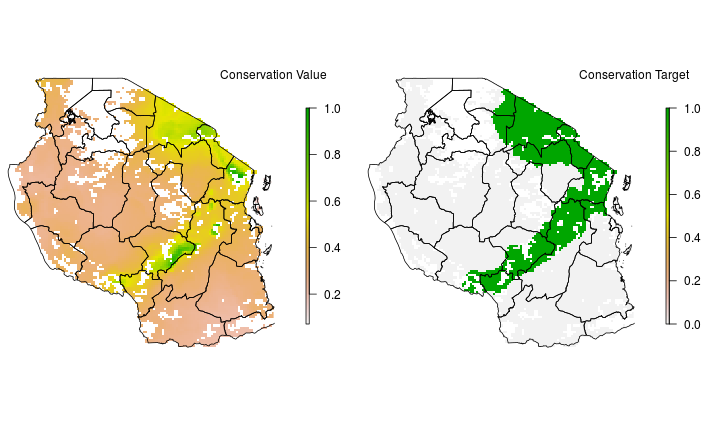
Conservation Priorities excluding Urban and Agricultural land
Conservation Priorities excluding Urban and Agricultural land.
Political system
Politics overview
Tanzania transitioned to a full democracy in 2010, and since then, research on the political system has been limited. Despite the transition to multiparty democracy, the long-term ruling party, Chama Cha Mapinduzi (CCM), continues to rule the presidency and assembly. Since 1995, the party has maintained between 60-80 percent of the seats in the legislature and votes in presidential elections. Some suggest that this is due to a legal and institutional framework that favors the ruling party (van Cranenburgh 1996). Others suggest that the CCM has maintained strength because of its roots in ujamaa socialism and its public-sanctioned respect for rules (i.e., unlike many other African countries, the party has not tried to change constitutional rules like term limits) (Lawson and Rakner 2005). CHADEMA and CUF are opposition parties, but these parties are fairly weak and their leadership has changed several times. Kelsall (2003) suggest the weakness in opposition parties is due to the absence of associations like trade unions and civil society groups that have laid the groundwork for opposition parties in other African countries (Kelsall 2003). Religious organizations, however, are strong social bodies in Tanzania (Lawson and Rakner 2005).
Pre-2000 political science scholarship on Tanzania highlights the political system’s tendency to produce clientelistic relationships between constituents and elected leaders (van Cranenburgh, 1996). This legacy is important, as it may be engrained as part of political processes today. That said, the Central Bank and civil service are said to be largely independent despite the fact that the president is charged with appointment (Lawson and Rakner, 2005), which may indicate that the system has become less clientelistic than it was in years passed. The Tanzanian government has also made strides to reduce corruption and increase transparency. A centralized payment and financial management system are used to oversee the Tanzanian budget, which limits the opportunities for spending beyond what is stipulated in the budget, but there is not much transparency in the budget allocation process (Lawson and Rakner, 2005).
Executive Structure
Tanzania is a president-parliamentary system, meaning that the president appoints the prime minister and can dissolve the cabinet. Jakaya Mrisho Kikwete has been president since 2005. Filling his two-term limit, a new candidate will run in the 2015 election. Presidents are elected for five-year terms, and in addition to cabinet appointment authority, have some legislative powers. Although the president in Tanzania is not as constitutionally powerful as in Burkina Faso and Senegal, there are few constitutional requirements that stipulate that the president be accountable to the legislature. Anecdotal evidence suggests that authority is concentrated in presidency and with his senior ministers (Lawson and Rakner 2005).
Electoral rules and party arrangement
Tanzania’s legislature and president is elected via plurality rule in single-member districts. In the 350 person unicameral assembly, 239 seats are filled via election. Women are required to hold 30 percent of the assembly’s seats, but these women are appointed by their parties rather than elected (Meena 2003) in proportion to the number seats that parties gain through election. The president can appoint up to ten additional members to the legislature. Members serve five-year terms.
Party discipline in legislative voting is surprisingly strong in the Parliament given that democratic consolidation and institutionalization is still in progress, and given that the system’s electoral rules usually prompt legislative individualism. Despite being disciplined, Members of Parliament (MPs) seem to exist in a largely undefined role. They are in frequent conflict with other levels of government, particularly the district government. These conflicts seem to be the result of CCM dominance as well as overlapping and unclear authority in the national and district-level government structures (Lawson and Rakner 2005). Given the powers of the president, the powers of the local government, and a disciplined CCM party, it is plausible that the legislature has limited oversight on and input in law making.
Decentralization
The Constitution and a series of legislative documents, including the 1982 Local Government Acts, 1997 the Regional Administration Act, the 1999 Local Government Laws Act, and the 2002 Public Services Act outline the basis of the local government structure. In addition to these basic laws, the 1996-2000 Local Government Reform Agenda decentralizes tasks to local government to improve service delivery.
The country is divided into 26 administrative regions, which are then divided into districts and then divisions. The district authorities in rural areas include district councils, village councils, township authorities, and ward development committees. The first three entities have authority to pass local budgets and form by-laws. Village and township councils are responsible for formulating plans in their local areas. It is not clear how the executive branch, of which includes the District Executive Director and regional commissioners, relates to the legislative body, the councillors. Powers between these bodies seem to overlap and, as in the national case, are not explicitly assigned (Lawson and Rakner, 2005). If the district level executive is not subject to oversight via the local assembly, and instead is an extension of the central government executive, this may explain why local legislative agents conflict with national MPs. Council agents are elected every five years, and chairpersons and mayors are elected by these councils. Local government revenue is fairly small, accounting for less than 20 percent of the local government budget (ibid). Local governments thus rely heavily on central transfers.
References
- AICD. 2010. Tanzania’s Infrastructure: A Continential Perspective. Africa Infrastructure Country Diagnostic.
- Benson, Todd, and et al. 2012. The Supply of Inorganic Fertilizers to Smallholders in Tanzania. IFPRI.
- Cooksey, Brian. 2013. The Comprehensive Africa Agriculture Development Programme (CAADP) and Agricultural Policies in Tanzania: Going with or against the Grain?. FAC Political Economy of Agriculture Policy in Africa.
- FAO. National Aquaculture Sector Overview: United Republic of Tanzania. FAO. http://www.fao.org/fishery/countrysector/naso_tanzania/en.
- Gine, Ricard, and Agusti Perez-Foguet. 2008. Sustainability Assessment of National Water Supply Program in Tanzania. Natural Resources Forum 32: 327–42.
- Keding, G.B., Msuya, J.M., Maass, B.L., & Krawinkel, M.B., 2013. Obesity as a public health problem among adult women in rural Tanzania. Global Health: Science and Practice 1: 359-371.
- Kelsall. 2003. Governance, Democracy, and Recent Political Struggles in Mainland Tanzania. Commonwealth and Comparative Politics 41(2): 55–82.
- Lawson, Andrew, and Lise Rakner. 2005. Understanding Patterns of Accountability in Tanzania. Oxford Policy Management.
- Meena, Ruth. 2003. The Politics of Quotas in Tanzania. Presented at the International Institute for Democracy and Electoral Assistance Conference.
- Ministry of Health and Social Welfare (MHSW) & Tanzania Food and Nutrition Centre (TFNC). 2014. Tanzania National Nutrition Survey 2014. MHSW.
- National Bureau of Statistics (NBS) (Tanzania) & ICF Macro, 2011a. Tanzania Demographic and Health Survey 2010. Dar es Salaam, Tanzania: NBS and ICF Macro.
- National Bureau of Statistics (NBS) (Tanzania) & ICF Macro, 2011b. Micronutrients: Results of the 2010 Tanzania Demographic and Health Survey. Dar es Salaam, Tanzania: NBS and ICF Macro.
- National Bureau of Statistics (NBS) (Tanzania), 2011. Tanzania National Panel Survey Report (NPS) - Wave 2, 2010-2011. Dar es Salaam, Tanzania: NBS.
- Pallotti, Arrigo. 2008. Tanzania: Decentralizing Power or Spreading Poverty? Review of African Political Economy 1116: 221–35.
- Pan, Lei, and Christiaensen. 2012. Who Is Vouching for the Input Voucher? Decentralized Targeting and Elite Capture in Tanzania. World Development 40: 1619–33.
- UN Children’s Fund (UNICEF), 2014. The State of the World’s Children 2015: Reimagine the Future: Innovation for Every Child. UNICEF.
- USAID. 2011b. Property Rights and Resource Governance in Tanzania. USAID.
- Van Cranenburgh, Oda. 1996. Tanzania’s 1995 Mulitparty Democracy: An Emerging Party System. Party Politics 2: 535–47.
- Wetengere, Kitojo, et al., 2008. Strategic review of aquaculture extension in Tanzania. FAO Aquaculture Newsletter (FAN) 41: 36-38.
- World Food Programme (WFP), 2012. Comprehensive Food Security and Vulnerability Analysis (CFSVA): Tanzania. WFP.