Ethiopia
Introduction
USAID’s Feed the Future Initiative in Ethiopia focuses on chickpea, coffee, dairy, hides and skins, honey, livestock, maize, potato, sesame, and wheat value chains. Key investment areas include strengthening the environment to support broad-based agricultural growth, improving productivity, expanding commercialization, enhancing resilience from shocks and disasters, and increasing the nutrition status of women and children.
Ethiopia is involved in several other FtF Innovation Labs. The Lab for Climate Resilient Chickpeas is established within the Ethiopian Institute of Agricultural Research (EIAR). Ethiopia is the largest chickpea producers in Africa. The genetic research program seeks to generate better varieties of chickpea to build resilience to climate change and increase small farm productivity. The Lab for Sorghum and Millet aims to improve the adaptation and resilience of sorghum and pearl millet through improved technologies, knowledge dissemination, and value chains. The Lab for Reduction of Post-Harvest Loss focuses on advancing improved technologies such as solar dryers for cereal grains, hermetically-sealed bins for grain storage, and “Purdue Improved Cowpea Storage bags”. The Lab for Market Access has several projects, most of which focus on weather insurance and index-based livestock insurance. The research in the Lab for Small-Scale Irrigation centers on identifying context-appropriate small-scale irrigation technologies and evaluating constraints and trade-offs to using these technologies.
Ethiopia is also part of USAID’s Africa Rising project, which takes an integrated approach (focusing on technologies, management, and context such as policy environments) to strengthen farming systems in the Ethiopian highlands.
Ethiopia is located between a latitude between 3.4 °N and 14.8 °N. The total land area is about 1 million km2. The country is administratively subdivided into 11 Astedader (Citys), and these are further sub-divided into 80 Zone .
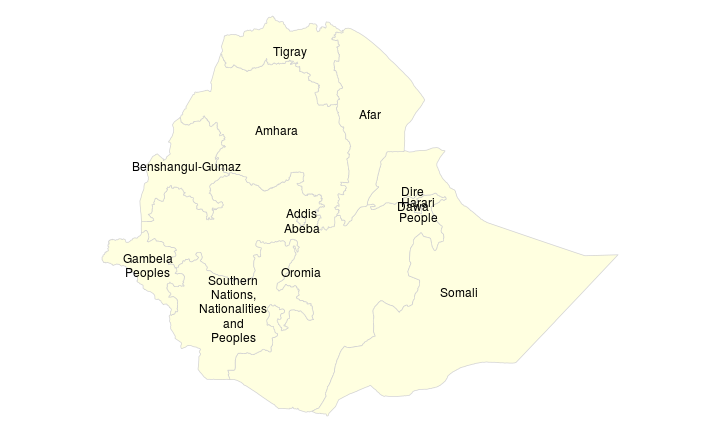
Administrative Divisons Map
The citys of Ethiopia
Human development
Population
Ethiopia has about 98.9 million inhabitants. The population has increased 2.3 fold over the past 30 years. The economically active population is 50.9 million, 75% of which is employed in agriculture (down from87% in 1985). The rural population was 88% in 1985 and now it is 82%.

Development
Since 2000, road networks and electricity generation capacity have expanded significantly. Government spending as a percentage of GDP is one of the highest in Africa. Poverty remains very high, cell phone and telecommunications use is limited, and mobility is stifled due to insecure land tenure (Dorosh and Rashid 2013).
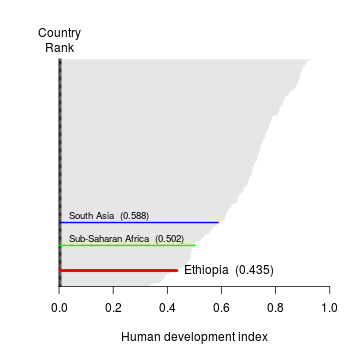
Human Development Index ranking and value
Human Development Index ranking for Ethiopia. Data source: UNDP.
Gender
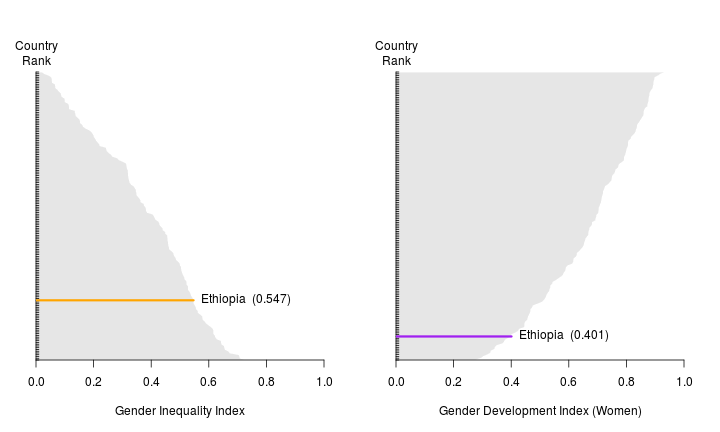
Gender Inequality and Development Indexes
Gender Inequality and Development Indices for Ethiopia. Data source: UNDP.
Health and nutrition
Life expectancy in Ethiopia increased significantly from 43 in 1970 to 64 in 2013 (UNICEF, 2014). Likewise, over the same timeframe under-five mortality decreased from 24 to 6.4% (UNICEF, 2014), though the 2011 Ethiopia Demographic and Health Survey (EDHS) estimated the rate to be 8.8% (CSA & ICF International, 2012). Nationally, rates of stunting, wasting, and underweight were estimated to be 44%, 10%, and 29%, respectively in 2011 (CSA & ICF International, 2012), however, stunting and underweight rates are rapidly declining. Stunting reduced from 58% in 2000 to 44% in 2011, underweight decreased from 41% in 2000 to 29% in 2011, and wasting remained essentially unchanged (CSA & ICF International, 2012). On average, rural households experience a much higher proportion of stunting, wasting, and underweight than urban households. Regional variation in child anthropometry estimates is drastic: stunting varies from over 50% in Amhara, Tigray, and Affar to 22% in Addis Abba; wasting from 22% in Somali to less than 5% in Addis Abba; and underweight from 40% in Affar to only 6% in Addis Abba (CSA & ICF International, 2012).
Less than 4% of women have short stature (BMI < 145cm) in Ethiopia (CSA & ICF International, 2012). About 27% of women are underweight (BMI < 18.5) and only 6% are overweight or obese (BMI ≥ 25). Men have even higher rates of underweight (37%), and overweight or obesity rates of less than 3% (CSA & ICF International, 2012). Rural households generally have higher rates of underweight than urban households. Estimates of the prevalence of overweight and obesity in women are less than 3% in rural households, but more than five times greater in urban households (15%, CSA & ICF International, 2012). Regionally, prevalence of underweight in women varies from 44% in Affar to 14% in Addis Ababa, while the prevalence of overweight or obesity ranges from 20% in Addis Ababa to only 3% in Benishangul-Gumuz and Tigray. The 2011 EDHS indicates that Somali has the highest prevalence (62%) of underweight men.
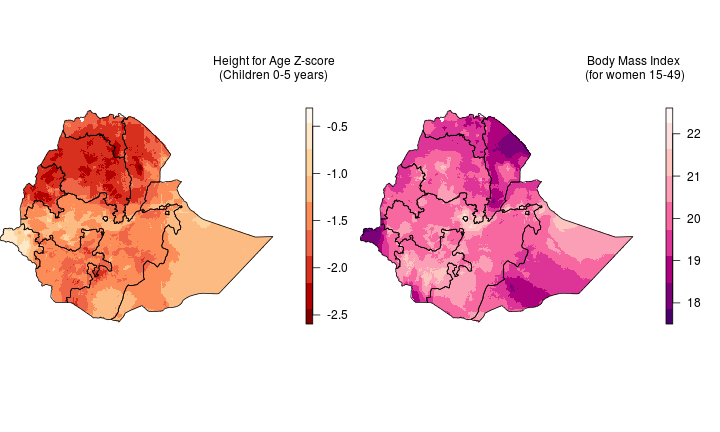
Child height-for-age Z-score and women’s body mass index
Average height-for-age Z-score for children (a child with a score less than -2 is considered stunted), and body mass index for women. Data source: DHS.
Micronutrients
The 2011 EDHS estimates that 44% of Ethiopian children have some form of anemia. Variation regionally spans from 75% in Affar to 33% in Addis Ababa (CSA & ICF International, 2012). Nationally, anemia prevalence in children decreased from 54% in 2005 to 44% in 2011 (CSA & ICF International, 2012). Approximately 17% of women have some form of anemia (CSA & ICF International, 2012). Prevalence is higher in urban (11%) than rural (18%) households, and highest in Somali (44%, CSA & ICF International, 2012). Men have lower rates of anemia (12%) than both children and women (CSA & ICF International, 2012). The 2011 EDHS estimates that only 6% of children take iron supplements weekly, and 83% of women took no supplements during their last pregnancy. Demissie, Ali, Mekonen, Haider, and Umeta (2010) estimated that 38% of children were vitamin A deficient in Ethiopia in 2005-2006.
About half (53%) of children received a vitamin A dose in the six months prior to the EDHS, and 16% of women received a postpartum vitamin A dose in the first two months after their last birth. Consumption of supplementary foods rich in vitamin A and iron to children 6-23 months falls far below recommendations. Gambela has the highest supplementary feeding rates of both vitamin A and iron rich foods to children 6-23 month old, while Affar had the lowest rates in both (CSA & ICF International, 2012). According to a 2005 study by Abuye et al. (2007), only 17% of children between 6-12 years of age in Ethiopia (excluding the region Somali because of insecurity issues) had adequate blood iodine levels, and 40% had palpable or visible goiter. The 2011 EDHS found that on average, 15% of households used iodized salt, though it was not tested for adequacy. About 23% of urban households and 13% of rural households use iodized salt (CSA & ICF International, 2012). Benishangul-Gumuz had the highest rate of households using iodized salt (40%), while Harari and Dire Dawa both had a rate of only 6% (CSA & ICF International, 2012).
Over a quarter of the population in Ethiopia have inadequate diets (26%); half of households consume over 75% of calories from starchy staples (WFP, 2014). Poverty is associated with a higher consumption of cereals, yet 57% of those in the poorest wealth index (by assets) still consume an acceptable diet, suggesting that diet quality is not solely dependent on higher incomes. An estimated 45% of food consumed in rural Ethiopia is self-produced by the household, while urban residents consume about 90% of their food from vendors or shops (WFP, 2014). Production of Ensete may improve food security in highland regions susceptible to drought and famine: it is high yielding, low in phytates, available year round, withstands drought, and may be stored for years (Pijls et al., 2006). Lastly, traditional methods of milk fermentation where industrial methods are impractical can greatly reduce the risk of food poisoning from dairy consumption (Makita et al., 2012).
The New Alliance for Food Security and Nutrition works on policy changes and investments African agriculture to benefit smallholder farmers and reduce hunger and poverty. They have a country report for Ethiopia.
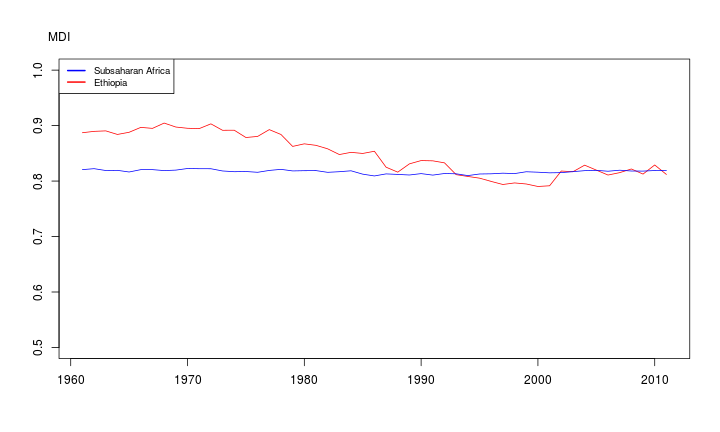
MicroNutruent Density Index
Micronutrient Density Index (MDI) between 1961 and 2011. Source: Beal et al.
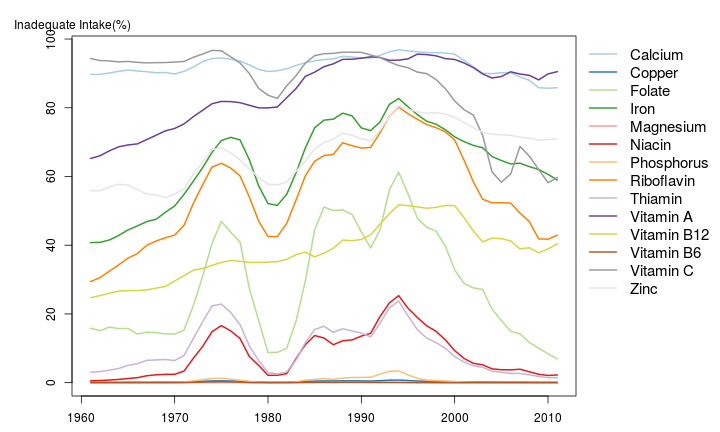
Prevalence of Inadequate Nutrient Intake
Estimated prevalence of inadequate intake (%) of micronutrients between 1961 and 2011. Source: Beal et al.
Land and water resources
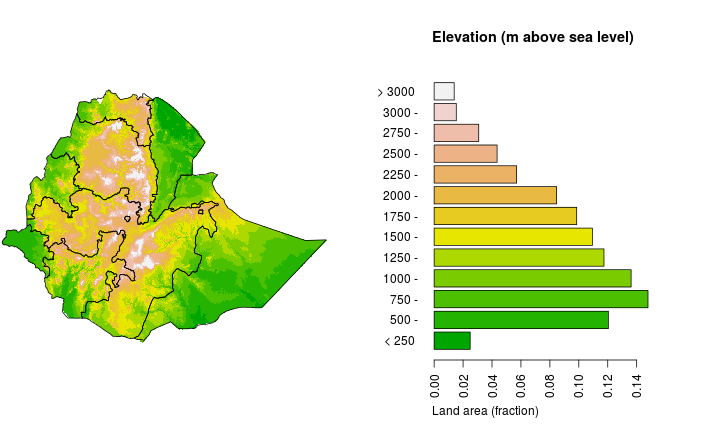
Elevation
The elevation of Ethiopia is between -190 and 4420 meters above sea level. Half the land area is below 1150 meter and in between 680 and 1740 meter.
Climate
Ethiopia has extreme geographic differences in rainfall patterns. Four general rainfall zones can be distinguished:
- Lowlands in east, northeast, and southeast Ethiopia: very little rainfall (less than 400 mm per year). The Afar Lowlands in the northeast are particularly dry and hot, receiving less than 100 mm of annual rainfall.
- Eastern mountain highlands: a single rainy season from February/March to October/November
- East Ethiopia: two rainy seasons (the Belg and the Meher), peaking in April and September
- South/Southeastern lowlands: two rainy seasons, February-April and June-September, interspersed with two distinct dry periods. Annual rainfail in this region can be as much as 2,000 mm. (FAO AQUASTAT)
The annual average temperature in Ethiopia is between 5.6 and 31 °C. The median annual average temperature is 23.2 °C and half the land area has an annual average temperature between 19.8 and 26.2 °C. For more details see the monthly temperature maps. For projected future climate change, see these maps.
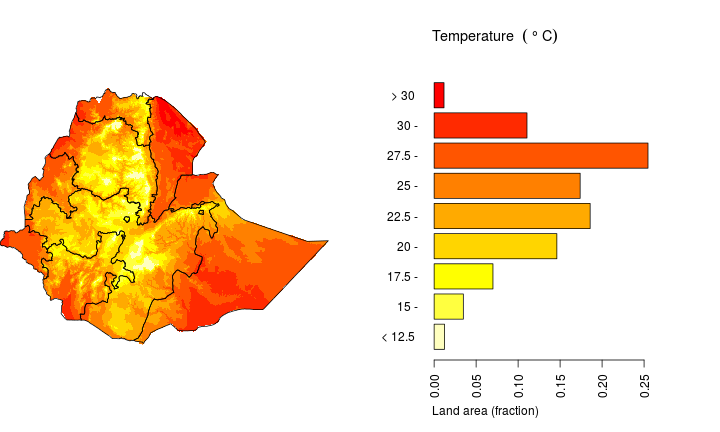
data source: WorldClim
Average annual mean temperature (°C) for 1950-2000 in Ethiopia. Source WorldClim
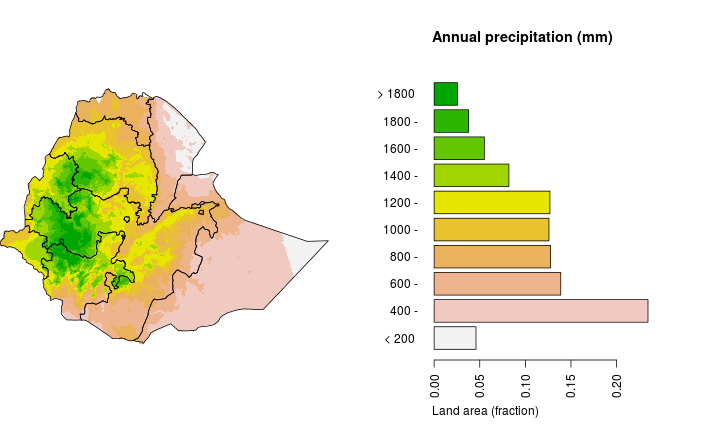
The annual total precipitation in Ethiopia is between 100 and 2160 mm. The median is 720 mm and half the land area has an annual total precipitation between 370 and 1110 mm. For more details see the monthly precipitation maps. For projected future climate change, see these maps.
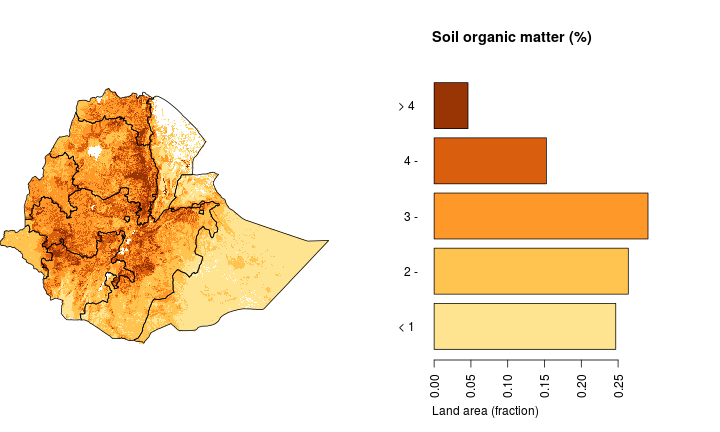
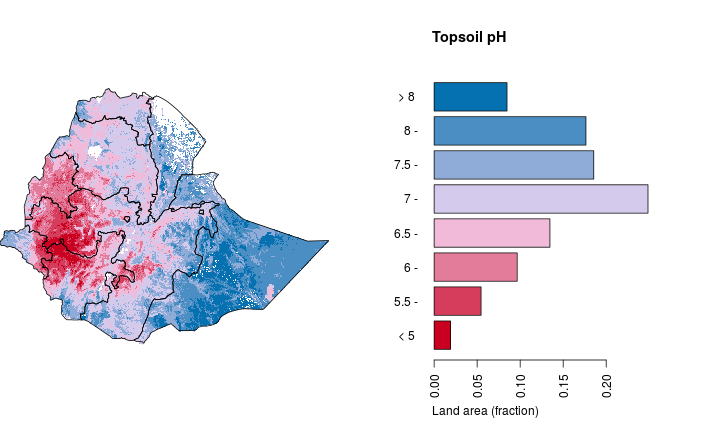
Soils
Water
Due to it mountainous topography, Ethiopia does not have any inflows of surface water. Ethiopia contributes to twelve major river basins. The four most important catchments are: * The Nile basin, which drains the north and west of the country westwards (33% of land area) * The Rift Valley, in central Ethiopia (28% of land area) * The Shebelli-Juba basin, which drains the southeastern mountains towards the Indian Ocean (33% of land area) * The North-East Coast (6% of land area)
Ethiopia contains a number of large lakes. The Rift Valley contains at least 8 major lakes running from the southwest to the northeast of the country. Lake Tana in Amhara region is the largest lake in Ethiopia, and is the source of the Blue Nile river. Most lakes have no surface water outlets, with the exceptions being Lakes Ziway, Tana, Langano, Abbayaa, and Chamo (Awulachew et al., 2009).
Irrigated agriculture is not widely practised in Ethiopia. About 10.8% of estimated land with potential for irrigation was irrigated as of 2001. Most irrigated land is used for annual crops like maize or vegetables, with less than 4% of irrigated area planted with permanent crops like citrus and bananas (FAO AQUASTAT). In 2002, per capita irrigated land was only 30 m2, and while it was projected to rise to 45 m2 per capita by 2015, it is still a fraction of the global average of 450 m2 per capita (Awulachew et al., 2009).
Irrigation can be very important in Ethiopia because precipitation is highly erratic. Most rain originates from convective storms that can have large spatial and temporal variability. This leads to frequent crop failures due to dry spells and droughts (FAO AQUASTAT, Awulachew et al., 2009).
The potential of using groundwater resources in Ethiopia is not known, but it appears that only a fraction of the groundwater resources has been exploited, mostly for local water supplies (Tadesse, 2004). Groundwater is generally not used for irrigation, but pilot projects are underway in East Amhara (FAO AQUASTAT).
Dams and aquaculture
Ethiopia currently has 13 dams with total capacity of 3,541 million m3. Because of its complex topography, Ethiopia has great potential for dam-building and there is a number of dam projects currently underway in the country, with most being built by Sinohydro of China and Salini Impregilo S.p.A. of Italy. Of note is the Grand Ethiopian Renaissance Dam, currently being built on the Blue Nile river in the Benishangul-Gumaz region, 500 km northwest of Addis Ababa. The dam will be the largest dam in Africa at 1,800m long, 170m high, and a total water volume of 10 million m3. When fully functional, it will provide an estimated 15,000 GWh of electricity per year.
Water policy and investment
According to the Constitution, the state owns all water resources. The 1999 Water Resources Management Policy decentralizes water management to regional boards and user communities. Permits are required for larger water infrastructure development, but not for smaller initiatives like hand-dug wells or water mills. For the most part, government-sponsored irrigation programs have not favored or served smallholder farmers much. The 2002-2016 Water Sector and Water Sector Development Strategy (WSWSDS) outlines plans for irrigation and other water infrastructure projects, emphasizing stakeholder involvement in management (USAID 2011a). The strategy aims to maximize the country’s irrigation potential without degrading the fertility and productivity of land and water. Detailed objectives include enhancing small, medium- and large-scale irrigation, promoting water use efficiency and preventing wastage, and researching and evaluating irrigation projects (WSWSDS).
The Ministry of Water and Energy is primarily responsible for water and irrigation development and investment. Regional water departments are responsible for water management within their boundaries.
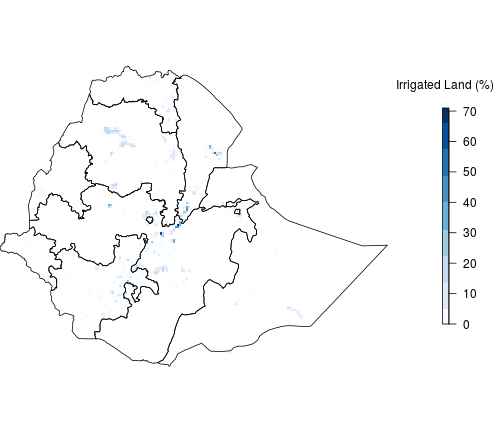
Map of Irrigated Agricultural Land
Percentage of agricultural land that is irrigated. Data source: GMIA
Ethiopia has several index insurance projects (Hill et al., 2013; Dercon et al., 2014). The International Livestock Research Institute (ILRI), has been offering Index-Based Livestock Insurance (IBLI) to pastorialists since at least 2011. The CGIAR has worked on index insurance as part of its Climate Change, Agriculture, and Food Security (CCAFS) program.
The R4 Rural Resilience Initiative led by Oxfam America, has been active in Ethiopia since 2009. R4 seeks to improve resilience for smallholder farmers by providing training in water management technologies as well as providing weather insurance. R4 insured over 25,000 total households in Ethiopia and recently expanded into the Amhara region from the Tigray region.
Land tenure
Property rights have been a major source of controversy and politicization. In the mid-1970s, government-led land grabs and forced resettlement led to a military coup. After the coup, previously privatized land was redistributed to the population with efforts to maintain equitability between farmers. Thus most of Ethiopia’s farms are smaller than two hectares. The policies and approach of this era has mostly been maintained. The state has ownership of the land and assigns user-rights to farmers and pastoralists, but these groups cannot use land as collateral for loans (USAID, 2011a).
The 2005 Federal Rural Land Administration and Land Use Proclamation transferred land administration to regional governments. Certification programs, which create a formal means for landholders to prove their stewardship, were first established to adjudicate land disputes at village levels in the late 1990s and are now managed by regional administrations. Over 20 million certificates have been issued since their establishment. Inheritance rights are also outlined in the policy. The 2005 Federal Rural Land Expropriation Proclamation makes improvements to the land administration system and compensation programs, and devolves additional authority to regional governments. However, critics argue that the legislation may have made it easier for regional administrations to take land from pastoralists for commercial development purposes (Abdulahi, 2007). Pastoral lands are mostly managed via customary rules (USAID, 2011a).
In the past decade, there were two main programs launched that aimed to increase land productivity. The first was a resettlement initiative that sought to move families from the Amhara and Tigray highland regions to lowlands along the Sudan border. Although the program was voluntary, it resembled forced resettlement during authoritarian rule and was therefore criticized. The second program that aimed to increase productivity involved making long-term land lease arrangements with foreign investors from countries including India and China. The transparency of these lease arrangements, including how residents are compensated, remain concerning (Deininger and Byerlee, 2011; IFAD, 2009). In 2010, the government had allocated around 1.2 million hectares to local and foreign investors (USAID 2011a). Although the Constitution requires that farmers be compensated for expropriated land according to the value of the seized property, there is evidence that receipt of compensation varies across regions. Moreover, compensation for regional infrastructure projects like roads and water works is not standard (USAID 2011a). Such land tenure policies contribute to Ethiopia’s urbanization rate, which is one of the lowest in Africa.
The Ministry of Agriculture, regional governments, Land Administration Committees at the kebele level are the government entities primarily involved in land tenure design and implementation. The Institute of Land Administration at Bahir Dar University trains many of the staff in these institutions.
Food production
Crop production
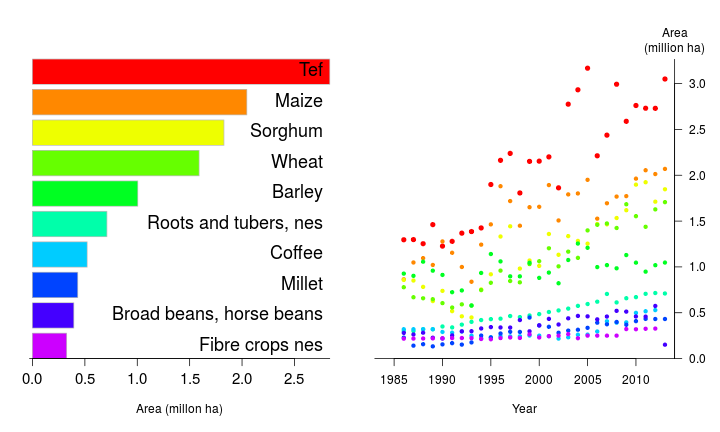
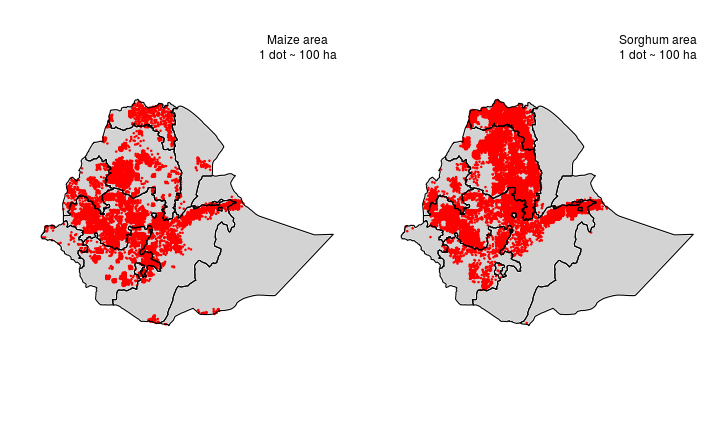
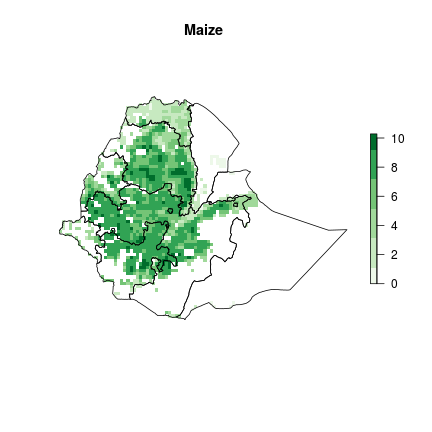
Cultivation Distribution
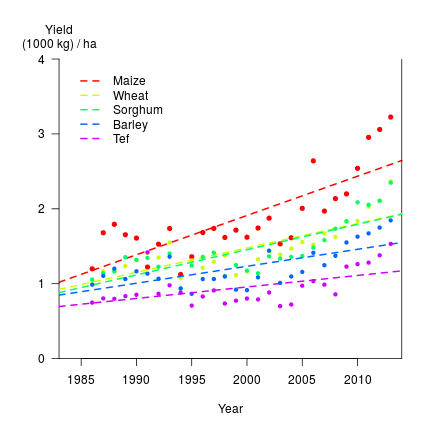
Crop Yield
Crop yield over the past 30 years, for the main five crops in Ethiopia. Data source: FAO.
Annual linear growth rates of crop yield over the past 30 years, for the main five crops , were between 15.4 (Tef) and 52.4 (Maize) kg/ha
Livestock
Despite livestock’s significant contribution to the Ethiopian economy, it has received limited policy attention even from the Ministry of Agriculture and Rural Development. A policy and strategy on livestock breeding has been developed, but it has been criticized for containing limited focus on important issues like animal health and nutrition. Ethiopia also lacks policy on the dairy sub-sector. The poor policy regime on livestock limits opportunities for development, making the sector ill equipped to deal with feed shortages from land degradation and overuse. In addition, no formal institution has the authority or responsibility for developing pastoral and agro-pastoral lands. The 2010/11-2014/15 Five-Year Growth and Transformation Plan addresses some of these gaps, emphasizing forage and livestock development, water for livestock, improvements in the marketing system, and increases in implementation capacity (MoARD 2010).
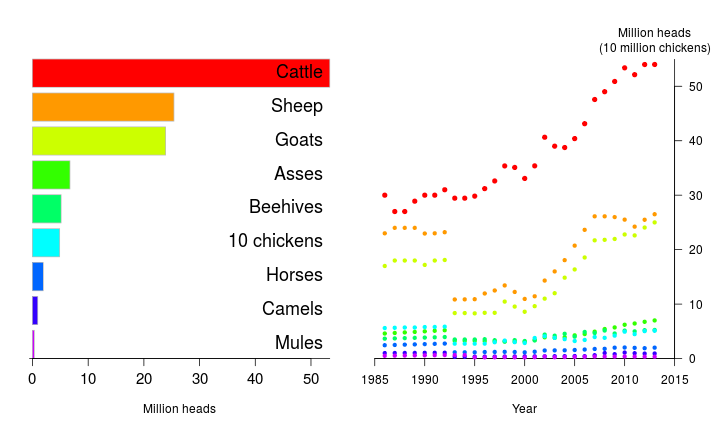
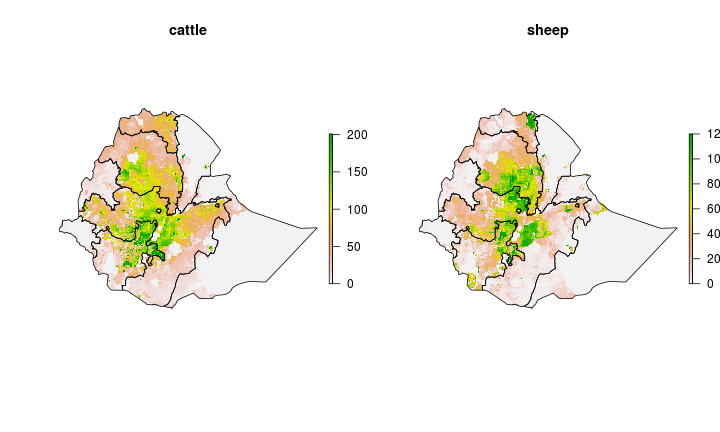
Livestock Distribution
Spatial distribution (head per km2) of cattle and sheep in Ethiopia. Data source: Gridded Livestock of the World. More livestock maps.
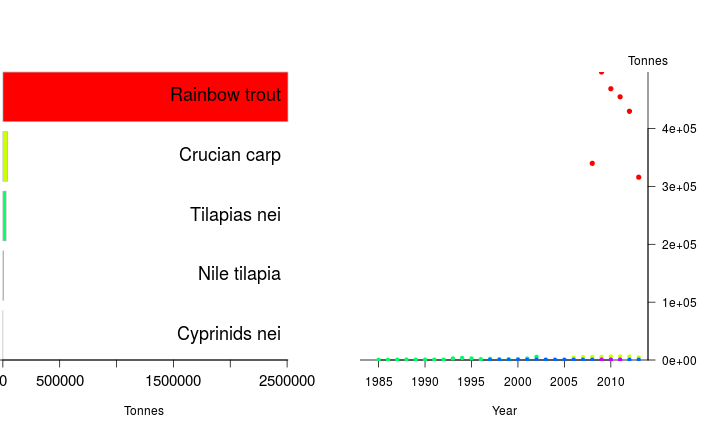
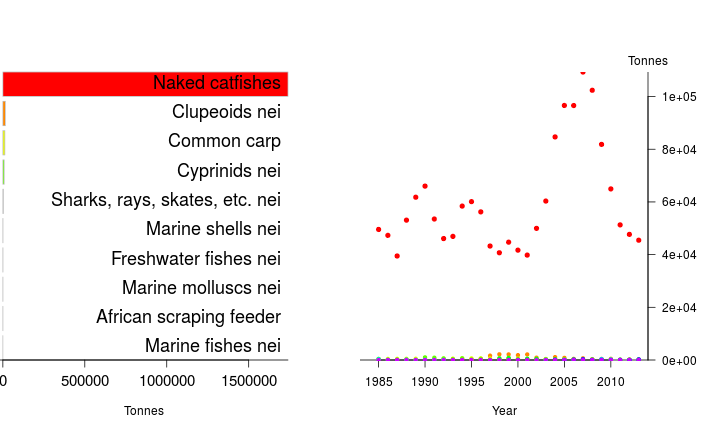
Aquaculture and fisheries
Aquaculture in Ethiopia is still in its fledgling stages despite potential, and in 2013 Wageningen UR and the FAO established a “multi-stakeholder platform” to provide technical knowledge and market intelligence. There are potential possibilities for commercial culture of tilapia in particular (van Dujin et al. 2012). The policy framework in aquaculture is unclear, but Ethiopia adhers to the African Union’s 2014 Policy Framework and Reform Strategy for Fishers and Aquaculture in Africa, which aims expand conservation, sustainability, and wealth generated from the sector cross-continentally.
Intensification
Ethiopia has a long history of government-led agricultural intervention (Keeley and Scoones 2000), which likely corresponds with reactions to the widespread famine and hunger of the 1970s and 1980s. Ethiopia has also invested in the provision of innovative social safety net programs that have replaced conventional emergency food aid distribution. The Productive Safety Net Programme (PSNP), for example, was introduced in 2005 and provides opportunities for the poor and unemployed to build infrastructure in exchange for food and cash transfers. It also offers complementary services such as skills training and credit. Survey evidence has found that the program has been mostly effective at targeting the poorest households (Dorosh and Rashid 2013).
The Ethiopian Government has controlled fertilizer markets through the Agricultural Input Supplier Enterprise (AISE) since the early 1990s, leading all activities concerning fertilizer including import planning and marketing and distribution. Import planning involves assessment at the district level: extension workers via the local agricultural bureau determine the demand for fertilizer. Regional agriculture bureaus are also involved, facilitating credit guarantees, transportation of fertilizer, and on-time delivery. Farmers’ organizations distribute fertilizers to farmers. Prices for inputs are significantly lower than in neighboring countries. It seems that low prices (through government-facilitation) have increased fertilizer use by 60 percent from 2007-2012 (Rashid and et al. 2013).
Recent research shows that 30-40 percent of Ethiopian smallholders use fertilizer (MoARD 2012). According to Ministry of Agriculture and Rural Development’s (MoARD) statistics, cereal accounts for 90 percent of the country’s total chemical fertilizer consumption and that two regions – Oromia and Amhara – account for 70 percent of this consumption. These figures may be at odds with or an inaccurate representation of farm-level use, however. A recent household survey of 3,000 farmers in four main regions that finds that 70 percent of farmers in Tigray use fertilizer and that only 40 percent use fertilizer in Oromia (Minot and Sawyer 2013). Fertilizer use for non-major cereal crops (e.g., tef, barely, rice, millet) is very limited, especially in high potential regions like Oromia and Amhara. Credit is a constraint: only ten percent of farmers in the survey mentioned above were able to purchase fertilizer with credit, and most of these instances occurred in the Tigray region. Some farmers are receiving credit, however, as illustrated by the figure below. These are likely large and commercial farmers. Farm size and the likelihood of using modern inputs are strongly correlated (MoARD 2012).
Modern seed use, unlike fertilizer use, is fairly limited. Lack of access to improved seed partly explains this (Rashid 2013). Pesticide use is not widespread (Minot and Sawyer 2013).
Ethiopia has invested heavily in its research and development institutions. The National Agriculture Research System (NARS), which includes the Ethiopian Institute for Agricultural Research (EIAR) and the Regional Agricultural Research Institutes (RARIs), focus on agricultural issues at national and regional levels. Over the last five years, new research institutions have been designed to focus on agro-ecologies (such as the lowlands and pastoral areas) that did not receive much attention previously. As demonstrated by the figures below, investment in research as been fairly steady but decreasing since the early 2000s.
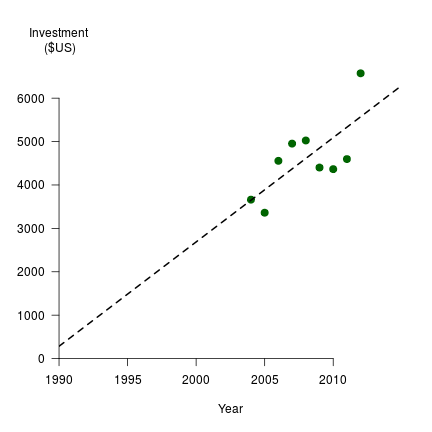
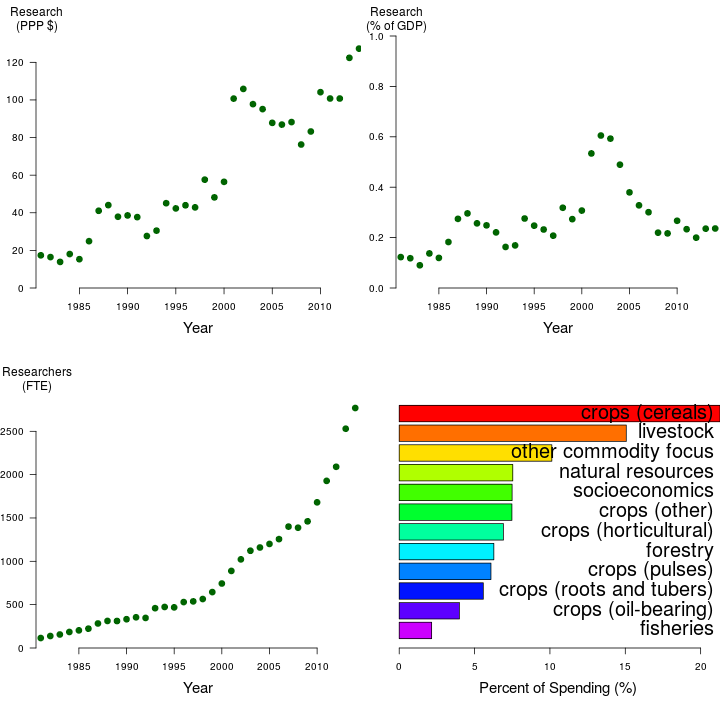
Investment in Agricultural Research
Investment in Agricultural Research over time and by commodity groups ( data source: ASTI).
Yield gaps
Yield Gap
Yield Gap (1000 kg / ha).
Fertilizer use
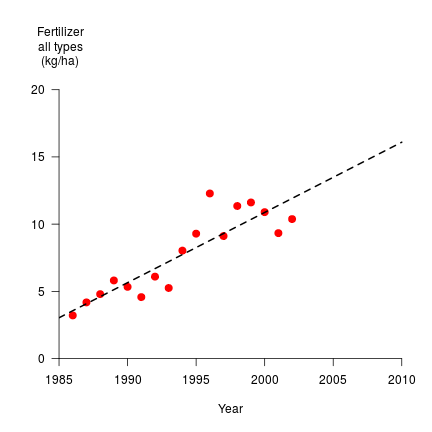
data source: FAO
Modern seed use, unlike fertilizer use, is fairly limited. Improved seed availability is part of this problem (Rashid 2013). Despite access to improved seed, the farmers that do use them are both large- and small-scale farmers. The difference between fertilizer and seed use at different farm sizes might be due to relatively cheap seed prices compared to fertilizer. The use of pesticide is not widespread (Minot 2013).
Selected research and development priorities and projects
The CGIAR has a large set of projects in Ethiopia. The International Livestock Research Institute has projects that focus on small-scale irrigation options for livestock feed production, climate-adaptive forage seed systems, value chain action plans for livestock, and sustainable-intensification of crop-livestock systems. The Livestock and Fish Research Program emphasizes research on small ruminant value chains. The Climate Change, Agriculture and Food Security Research Program has several research projects, including on analysis of policies purposed to respond to food security crises, assessment of risk management packages, the development of meteorological and hydrological stations for farm-level tools, participatory trails of durum wheat, and trials of cellphone-based information services. The International Food Policy Research Institute also has a Strategy Support System in Ethiopia, which focuses on improving policy-making processes, knowledge management, and evidence-based policy analysis. The Water, Land and Ecosystems Research Program (WLE) is “working to achieve green, resilient and equitable growth.” The Blue Nile Basin is one of the focal regions of the WLE, and the project partners with several institutions within Ethiopia, including the Amhara Regional Agricultural Research Institute and Makerere University. The WLE is currently conducting eight research projects in the Blue Nile Basin, including agrobiodiversity for ecosystem service restoration and ecosystems valuation. Africa Rising works on small scale mechanization in the Ethiopian highlands.
FAO’s current priorities for Ethiopia include maintaining focus on reducing hunger and malnutrition via assistance in creating effective agricultural policy and regulatory frameworks, and enhancing agriculture information and knowledge management (FAO Country Program Framework 2012-2015). FAO is also performing the Towards Climate Change and Adaptation project in Ethiopia PDF. The project is focused on the Wurba watershed in Amhara, benefiting 1,000 households over 3,000 ha of land. The most recent Poverty Reduction Strategy Paper focuses on industrial and export development of the agriculture sector, shifts to high value production, scaling up best practices and new technologies, intensification of small-scale irrigation schemes, commercial horticulture, and improving natural resource use to deal with climate change effects (IMF PRSP 2011-2015).
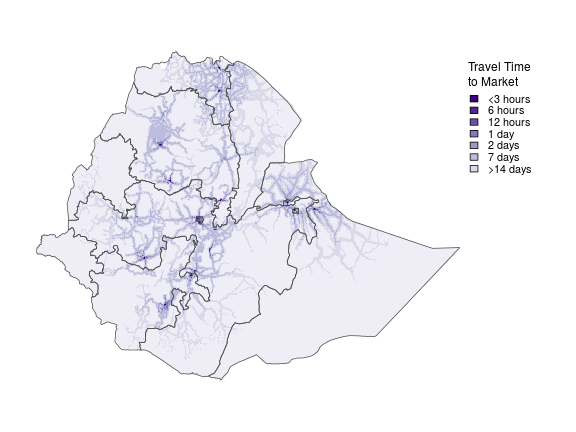
The Agricultural Water Solutions Project (AWM) PDF, active from 2008-2011, is a project by a consortium of research, scientific, and commercial organizations that seeks to unlock the potential of smallholder farmers in many countries around the world, including Ethiopia. The AWM focuses on addressing the needs of target populations rather than focusing on the development of additional water resources. One focus of the AWM is on mapping livelihoods, in order to understand the needs of the constituent farmers.
The US (African Development Foundation)[http://www.adf.gov/] supports many projects in Ethiopia
Nature conservation
About 18% of terrestrial Ethiopia is under some form of protection (IUCN & WDPA 2015). This includes 15 national parks (Category II), eight habitat/species management areas (Category IV), and 18 managed resource protected areas (Category VI), as defined by the IUCN. Across Ethiopia UNESCO has designated one natural area as a World Heritage Site Simien National Park, and two Biosphere Reserves. There are no Ramsar Wetlands of International Importance in the country.
Ethiopia is home to 120 species on the IUCN Red List of threatened and endangered species. This includes 14 listed as Critically Endangered, 36 as Endangered, and 70 as Vulnerable. Furthermore, Ethiopia contains six sites noted by the Alliance for Zero Extinction as locations having an imminent risk of species extinctions. These sites contain 10 at risk species.
African Wildlife Foundation is the only major global or regional environmental non-governmental organization with a current conservation program in Ethiopia. They operate in and around the Simien Mountains.
Global conservation prioritization methodologies have highlighted a total of 99% of Ethiopia as having conservation importance. This includes Biodiversity Hotspots (89% of the country), Global 200 Ecoregions (73%), Important Bird Areas (10%) and regions considered to be the Last of the Wild (9%) as defined by Wildlife Conservation Society. However, no area in the country is recognized as a Frontier Forest (Global Forest Watch).
The map on the left shows biodiversity conservation priorities generated by combining numbers of vertebrate species, (excluding reptiles), IUCN threatened species, and small-ranged species (data from Jenkins et al. 2013) per 10 km2 cell. Thus, the areas with the highest values (shown here in red) not only have the greatest diversity of species in Ethiopia, but also show those areas where species are or might become threatened with extinction. The map on the right highlights 17% of the terrestrial area of Ethiopia containing the highest conservation priority values (a 17% target was chosen in accordance with the 2010 Convention of Biological Diversity). The same analysis at both regional and global scales highlights 12% and 2% of the nation respectively as meeting the CBD targets as defined in this analysis.
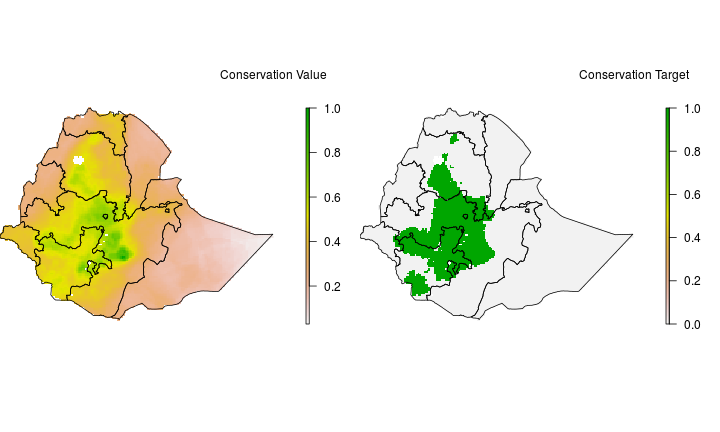
Conservation Priorities
Conservation Priorities.
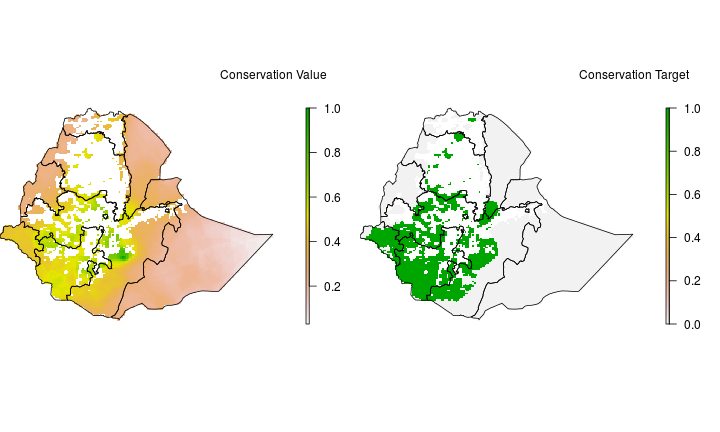
Conservation Priorities excluding Urban and Agricultural land
Conservation Priorities excluding Urban and Agricultural land.
Political system
Ethiopia has a history of state-sponsored oppression and violence, and is not considered a full democracy. The media is highly censored, and recent anti-terrorism legislation restricts the activities of civil societies (Committee to Protect Journalists 2015). The policies on terrorism are also used as a means to suppress opposition political parties through detainment and capital punishment of opposition party members (W.G. 2014).
Importantly, some of the government’s oppressive tactics have been linked to ethnicity (The Advocates 2012). There are thousands of political prisoners in Ethiopia (Human Rights Watch 2014) of whose treatment has been strongly criticized by organizations like Amnesty International and Human Rights Watch. Anecdotal reports indicate that aid, including aid for agricultural programs that support the distribution of inputs like fertilizer, has benefitted certain regions but not others, and that some groups, like the Oromos and Auaks, have been relocated by the government without compensation. These disparities may be linked to political ideology and party support. Although the Oromo ethnic group is the largest, for example, the Tigray and Amhara ethnic groups tend to dominate executive and legislative power (The Advocates 2012).
The Ethiopia’s Peoples Revolutionary Democratic Front (EPRDF) has been in power since 1991. Although opposition parties gained over one hundred seats in the 2005 election, conflict between the opposition party and EPRDF erupted. Disputes over election results caused protests, demonstrations, and state-led violence against protesters. The EPRDF’s crackdown is associated with their subsequent dominance in the 2010 election, in which the party won over 99 percent of the seats. The peaceful transition of power to current Prime Minister Hailemariam Dessalegn after the death of late Prime Minister Meles Zenawi, however, may represent the dawn of a potentially more democratic era in Ethiopia (Article 19, 2014). The 2015 elections should indicate whether a trajectory toward democracy continues.
Executive structure
Ethiopia has one of the few parliamentary systems in Africa. The president, is appointed by the prime minister and assembly and serves a six-year term. The current Prime Minister is the first Ethiopian prime minister in the past two centuries to be associated with non-Tigray and non-Amhara ethnic groups in the last two centuries. The Council of Ministers, subject to the oversight of the prime minister and assembly, is responsible for government.
Electoral Rules and party arrangement
The Ethiopian assembly is large and bicameral. The House of People’s Representatives has 547 seats and the House of Federation has 135 seats. Representatives in the former are elected via single-member district plurality rule and the latter are not elected but appointed by regional state councils. Both House and Senate members serve five-year terms.
Decentralization
The Ethiopian system has been characterized as highly centralized even despite it is decentralized according to legal frameworks. The Constitution and subsequent legislation have devolved powers and mandates to regions, districts (woreda), and villages (kebele). The regional government (which includes nine states that follow ethnic patterns) was established to extend the governing arm of the central government in the 1990s, and the district level was established to improve service delivery and local participation in economic development in the early 2000s (Dickovick and Gebre-Egziabher 2010). Although decentralization includes elections of local leaders, the single-party dominant situation has limited certain utilities of these reforms (i.e., empowering independence among local actors) (Garcia and Sunil Rajkumar 2008). Political autonomy is weak: the 2008 local elections, for example, were largely uncontested. Election outcomes indicate that elected local leaders are not autonomous, but function as an extension of the national government and the EPRDF (Dickovick and Gebre-Egziabher 2010).
Regional and administrative councils control the distribution of government-distributed resources like food assistance and inputs. The woreda administrations receive almost all of their funding for service provision from regional governments. Despite top-down provision, the provision responsibilities assigned to each level of government are mostly unclear, which results in duplicated efforts and budgetary challenges. That said, evidence shows that government transfers to woredas have been pro-poor, benefitting rural, food-insecure, and pastoral woredas (Garcia and Sunil Rajkumar 2008).
References
- Abdulahi, M. 2007. The Legal Status of the Communal Land Holding System in Ethiopia: The Case of Pastoral Communities. International Journal on Minority and Group Rights 14: 85–125.
- Abuye, C., Berhane, Y., Akalu, G., Getahun, Z., & Ersumo, T., 2007. Prevalence of goiter in children 6 to 12 years of age in Ethiopia. Food & Nutrition Bulletin 28: 391-398.
- Article 19. 2014. Ethiopia 2015 Elections: An Opportunity to Change Course and Increase Freedom of Expression. Article 19. http://www.article19.org/resources.php/resource/37788/en/ethiopia-2015-elections:-an-opportunity-to-change-course-and-increase-freedom-of-expression.
- Awulachew, Seleshi Bekele, et al., 2007 Water resources and irrigation development in Ethiopia. IWMI.
- Central Statistical Agency (Ethiopia) & ICF International, 2012. Ethiopia Demographic and Health Survey 2011. Addis Ababa, Ethiopia and Calverton, Maryland, USA: Central Statistical Agency and ICF International.
- Dercon, Stefan, et al., 2014. Offering rainfall insurance to informal insurance groups: Evidence from a field experiment in Ethiopia.” Journal of Development Economics 106: 132-143.
- Demissie, T., Ali, A., Mekonen, Y., Haider, J., & Umeta, M., 2010. Magnitude and distribution of vitamin A deficiency in Ethiopia. Food & Nutrition Bulletin 31: 234-241.
- Dickovick, J Tyler, and Tegegne Gebre-Egziabher. 2010. Comparative Assessment of Decentralization in Africa: Ethiopia Desk Study. USAID.
- Dorosh, Paul, and Shahidur Rashid. 2013. Food and Agriculture in Ethiopia: Progress and Challenges. IFPRI. IFPRI Issue Brief 74.
- Garcia, Marito, and Andrew Sunil Rajkumar. 2008. Achieving Better Service Delivery Through Decentralization in Ethiopia. World Bank. Working Paper 131.
- Hill, Ruth Vargas, John Hoddinott, and Neha Kumar, 2013. Adoption of weather-index insurance: learning from willingness to pay among a panel of households in rural Ethiopia. Agricultural Economics 44.4-5: 385-398.
- Human Rights Watch. 2014. “World Report: Ethiopia.” http://www.hrw.org/world-report/2014/country-chapters/ethiopia.
- IFAD. 2009. Country Programme Evaluation: Ethiopia. IFAD.
- Keeley, James, and Ian Scoones. 2000. “Knowledge, Power, and Politics: The Environmental Policy-Making Process in Ethiopia.” The Journal of Modern African Studies 36(1): 89–120.
- Makita, K., Desissa, F., Teklu, A., Zewde, G., & Grace, D., 2012. Risk assessment of staphylococcal poisoning due to consumption of informally-marketed milk and home-made yoghurt in Debre Zeit, Ethiopia. International journal of food microbiology, 153: 135-141.
- Minot, Nicholas, and Bradley Sawyer. 2013. Input Use in Ethiopia: Results of the 2012 ATA Baseline Survey. IFPRI. REAP.
- MoARD. 2010. Ethiopia’s Agricultural Sector Policy and Investment Framework 2010-2015. Government of Ethiopia.
- Pijls, L.T., Timmer, A.A.M., Wolde-Gebriel, Z., & West, C.E., 2006. Review on cultivation, preparation and consumption of ensete (Ensete ventricosum) in Ethiopia. Journal of the Science of Food and Agriculture 67: 1-11.
- Rashid, Shahidur, and et al. 2013. “Can Modern Input Use Be Promoted without Subsidies? An Analysis of Fertilizer in Ethiopia.” Agricultural Economics 44: 595–611.
- Tadesse, K., 2004. Strategic planning for groundwater assessment in Ethiopia. A paper presented to International Conference and Exhibition on Groundwater in Ethiopia.
- The Advocates. 2012. Ethiopia: Violations of the Rights of the Disadvantaged Ethnic Groups. The United Nations.
- UN Children’s Fund (UNICEF), 2014. The State of the World’s Children 2015: Reimagine the Future: Innovation for Every Child. UNICEF.
- USAID. 2011a. Property Rights and Resource Governance in Ethiopia. USAID.
- van Duijn, AP, et al., 2012. Business opportunities for aquaculture in Ethiopia. LEI Wageningen UR.
- W.G. 2014. “Snatched: Justice and Politics in Ethiopia.” The Economist. http://www.economist.com/blogs/baobab/2014/07/justice-and-politics-ethiopia.
- World Food Programme (WFP), 2014. Comprehensive Food Security and Vulnerability Analysis (CFSVA): Ethiopia. WFP.
- http://www.ifpri.org/sites/default/files/publications/essprn11.pdf